Building09:12
More to save today
hold 2F Retail at 26 °C and dim to 45% after 18:00
We turn raw IoT sensor data into clear, readable insight — with AI that analyses trends, flags problems early and recommends fixes. One system from the device on site to the alert in your team's hands, on Momo Space 4.0.
Power, temperature, humidity, water and pressure on site
Every device, any brand · Modbus · BACnet · MQTT · OPC UA
Hosted in Thailand · PDPA-compliant · daily backups
Momo Space 4.0 · real-time dashboards for every site
Momosight flags anomalies and advises what to do
Site teams and managers alerted on LINE · Email · Telegram
AI that does the work
Most plants collect more data than a person can review. Our AI doesn't just draw prettier charts — it reads the data for you and says where to look first.
Every device, any brand, in one place — the whole site at once.
Catches readings outside their limits and tells you over LINE / Email / Telegram.
Says why a reading is abnormal, not merely that it is.
Proposes what to do next, with reasoning you can check.
More to save today
hold 2F Retail at 26 °C and dim to 45% after 18:00
Fridge #2 jumps every day from 09:00 to 11:00, matching dispensing hours
open it less, or keep a separate fridge for daily stock
Battery dipped to 21.4 V on the test start, 9% lower than last month
replace it before the next test
DO sits above 3 mg/L at night when inflow is low
cut blower run time from 23:00 to 05:00
Illustrative — the figures are made up to show the format. Real messages cite readings from that site's own meters.
Sensors are only the way in. The real work is everything after that, and we do the whole chain ourselves — no juggling vendors.
Sensors, gateways and firmware designed for the site
Every device and every site on one screen
Catches anomalies, explains why, and advises what to do
MA and support, remote and on-site


Pick the business closest to yours. Each one starts from a problem the site really has, and only then chooses the devices and screens that answer it — not from a box of sensors looking for a use.
“A fridge leaves 2–8°C overnight and the vaccines are lost”
A temperature sensor in every fridge and cold room, logged continuously to the cloud, with a LINE alert as a reading leaves its range and an AlarmBox light and buzzer at the unit.
“Several charging sites, one electricity bill, and no way to tell which site spent what”
A meter on the distribution board that feeds each charger, reporting to the cloud continuously. Every site on one screen, a monthly kWh figure per site exported ready to bill from, and a LINE alert when load approaches the peak you set.
“The bill spikes on peak demand, and a power factor penalty lands on top”
Energy, current, voltage, power factor and peak demand measured at the main board and the sub-boards, phase by phase and feeder by feeder, with a LINE alert as a reading approaches its limit.
“The chillers run hard all day, the cooling still falls short, and the bill doesn't move”
Chiller power, chilled-water supply and return temperatures and flow measured together, giving the real cooling load and the kW per ton, with a LINE alert when efficiency drops or Delta-T drifts.
“A motor burns out mid-run, after a normal day yesterday”
Per-phase current, motor temperature and vibration measured continuously and compared with that motor's own normal, with a LINE alert as soon as a reading drifts.
“The machines hold the data; nobody is pulling it out”
Inverter values read over Modbus (ABB, Schneider, Siemens), with per-machine power, temperature and vibration on one screen — run hours, downtime and fault codes together.
“The compressor runs all day, and nobody knows where the air goes”
Power, pressure, flow and dew point measured continuously, run hours set against real production time, energy worked out per cubic metre of air, and a LINE alert when readings drift.
“How many kW of solar is worth installing? Not without the real load”
A three-phase meter at the main board records the real load for one to four weeks; the system works out the daytime average, the on-peak share, and a suitable array size with the share you would use yourself — from measurements, not estimates.
“No idea which floor uses the power, and it stays on after hours”
A SCADA screen showing energy floor by floor, with devices switched on and off and scheduled from that one screen.
“The power fails, and the generator doesn't start”
Fuel level, battery voltage, engine and ATS status and run hours all watched, with a LINE alert the moment anything is off.
“Effluent out of spec, found out when the inspector arrives”
pH, DO and level measured continuously, pumps and blowers monitored, blowers run on the DO actually measured, and the history logged.
“The server-room air-con fails at night, found out when systems go down”
Temperature and humidity measured around the racks and the room's power metered, with an instant LINE alert and an AlarmBox light and buzzer that staff acknowledge on the spot, the time logged automatically.
“The tank runs dry and you find out when the taps stop”
Tank levels, zone-by-zone meter volumes and pump status measured continuously, pumps refilling automatically on level through the Auto Control Box, and a LINE alert when water runs low or use looks wrong.
“Humidity out of spec, found out when the batch is rejected”
Temperature and humidity sensors zone by zone along the line, live on the dashboard, a LINE alert when a reading crosses its threshold, and scheduled reports by email.
“Walking every room to read meters at month-end”
Water and power meters in every room read themselves; the system works out the charges, issues the bill and sends it to each tenant on LINE.
“Empty rooms with the air-con on, and guests complaining first”
One dashboard showing room status on every floor, occupancy, plant power use, and temperature and humidity in public areas, with LINE alerts when something is off.
Connect any brand of device over any protocol, run every plant and site from one place, and let AI do the analysis — hosted in Thailand, PDPA-compliant, with daily backups and a 99.9% uptime SLA.
Fridge #2 jumps every day from 09:00 to 11:00, matching dispensing hours — open it less, or keep a separate fridge for daily stock
Example view — arrange the widgets per site
Six devices covering every use case — from a budget temperature sensor all the way up to a 3-phase power meter.
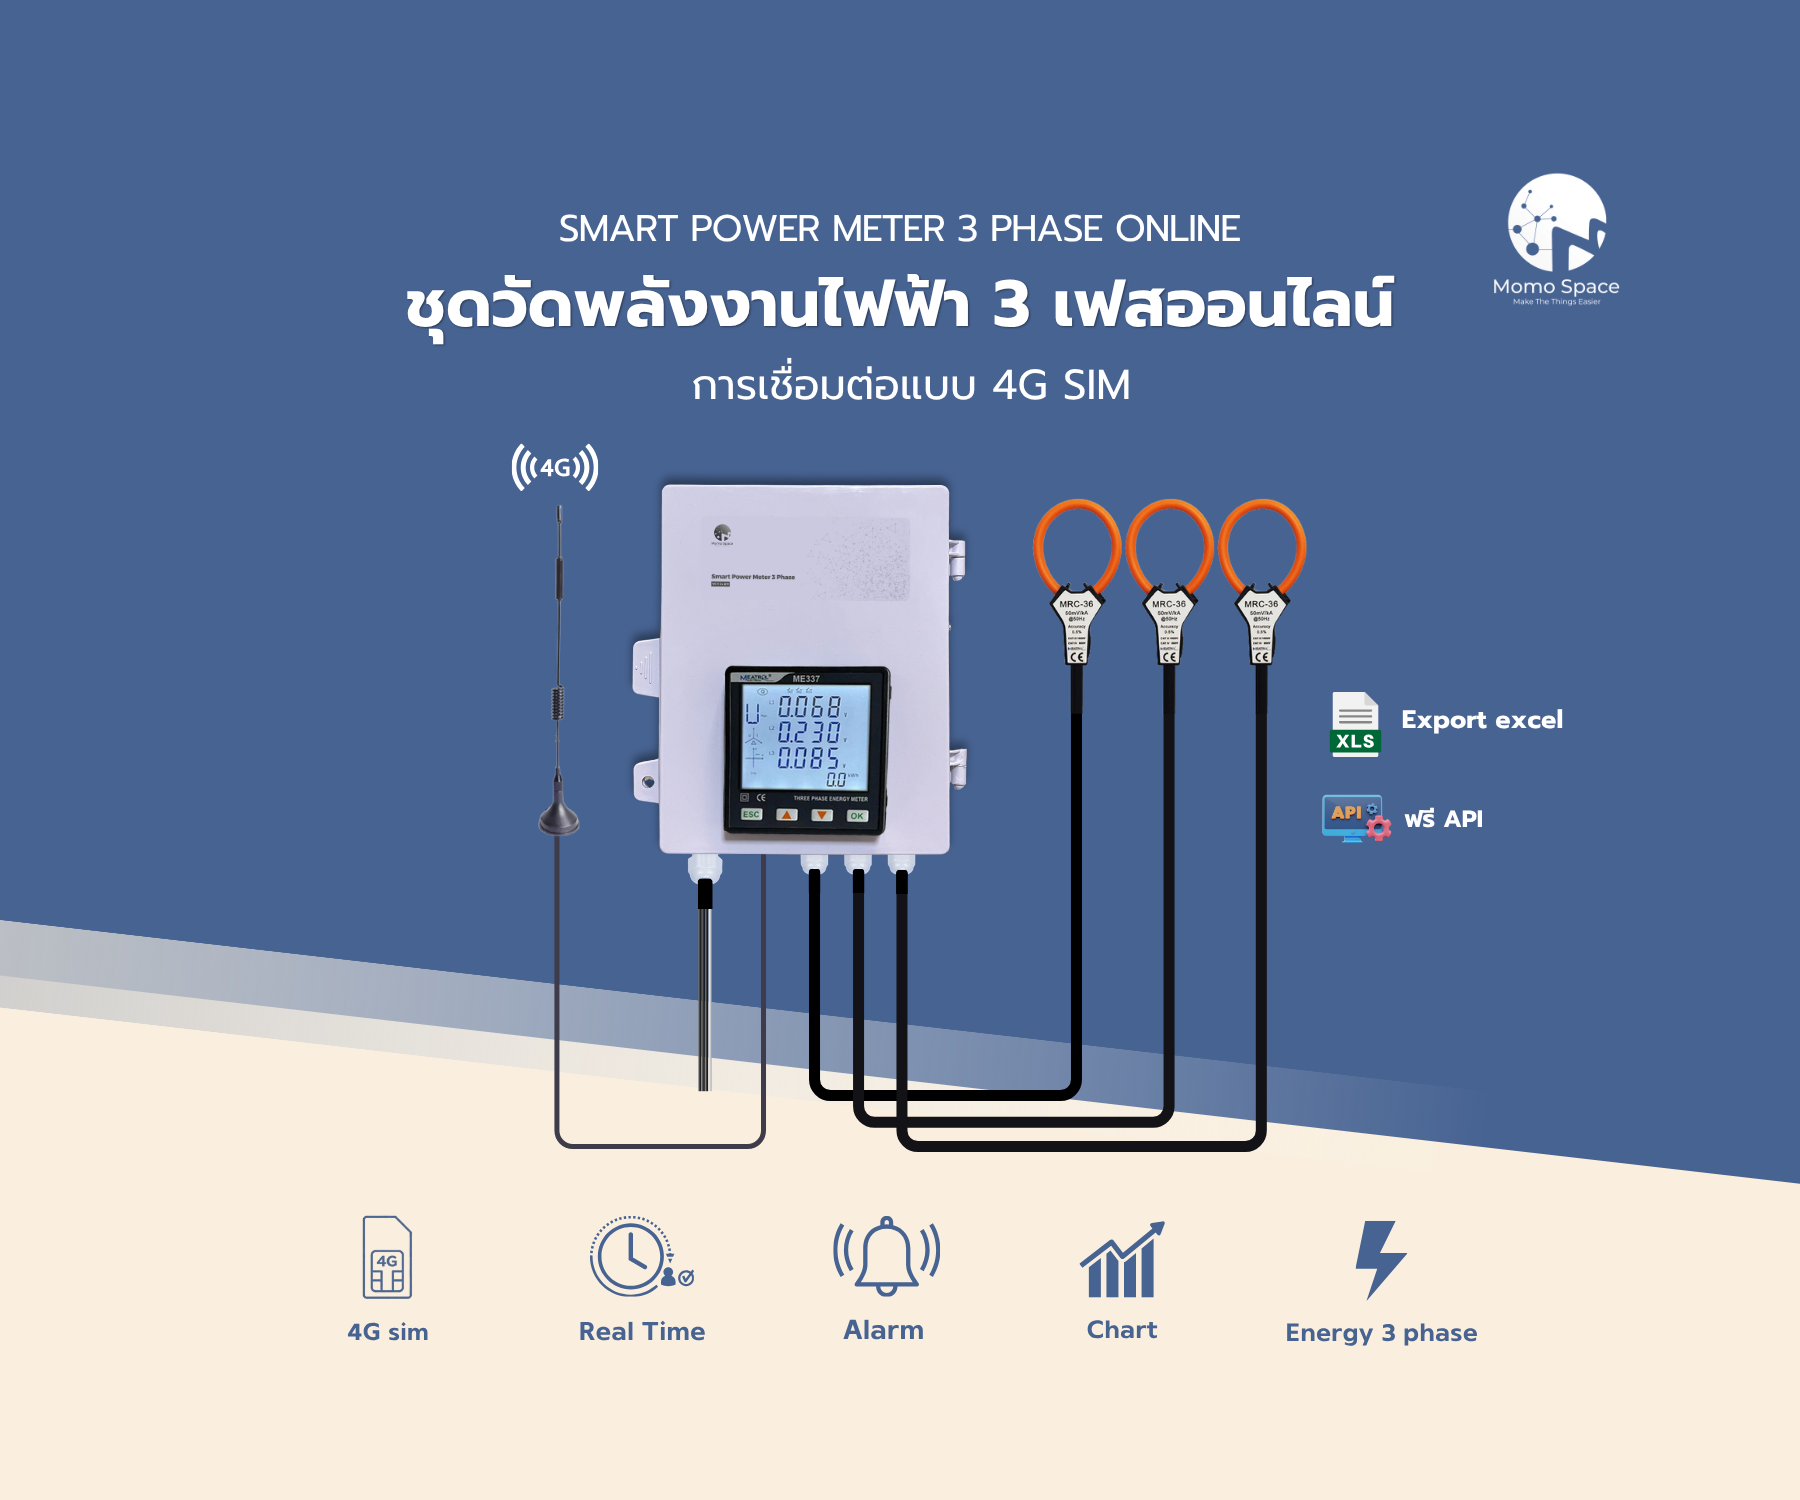
Three-phase online energy meter with 4G SIM connectivity and Flexible Rogowski Coil CTs (up to 600A). Ideal for sites without WiFi.

Measures current, voltage and power, streaming data to the cloud in real time.
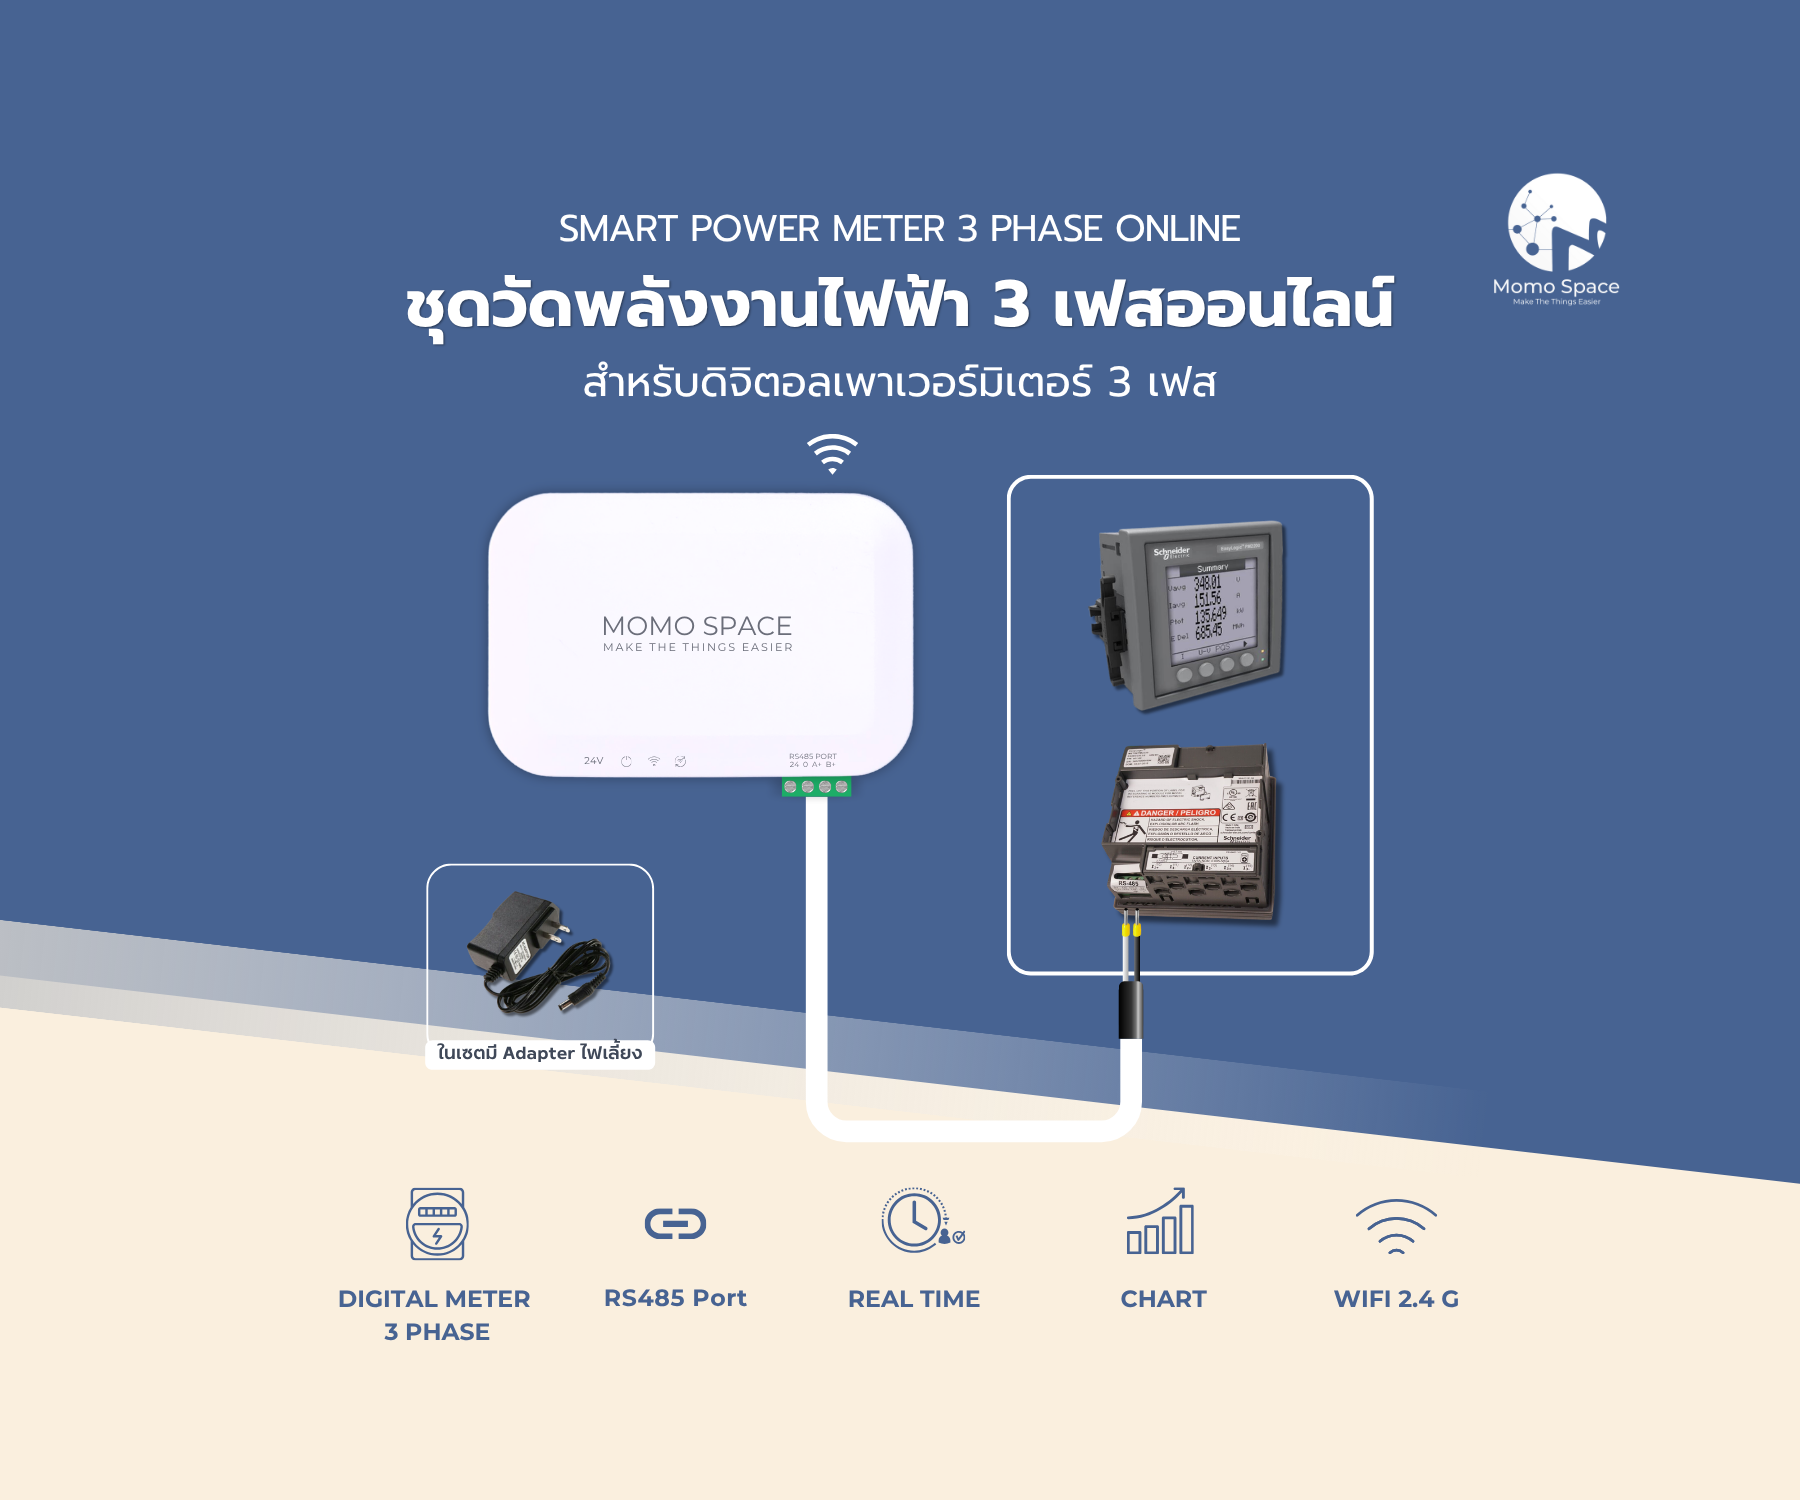
Mspace V2 — IoT gateway device that connects to existing Digital Meters and bridges them to the cloud. MODBUS-RTU/TCP compatible.
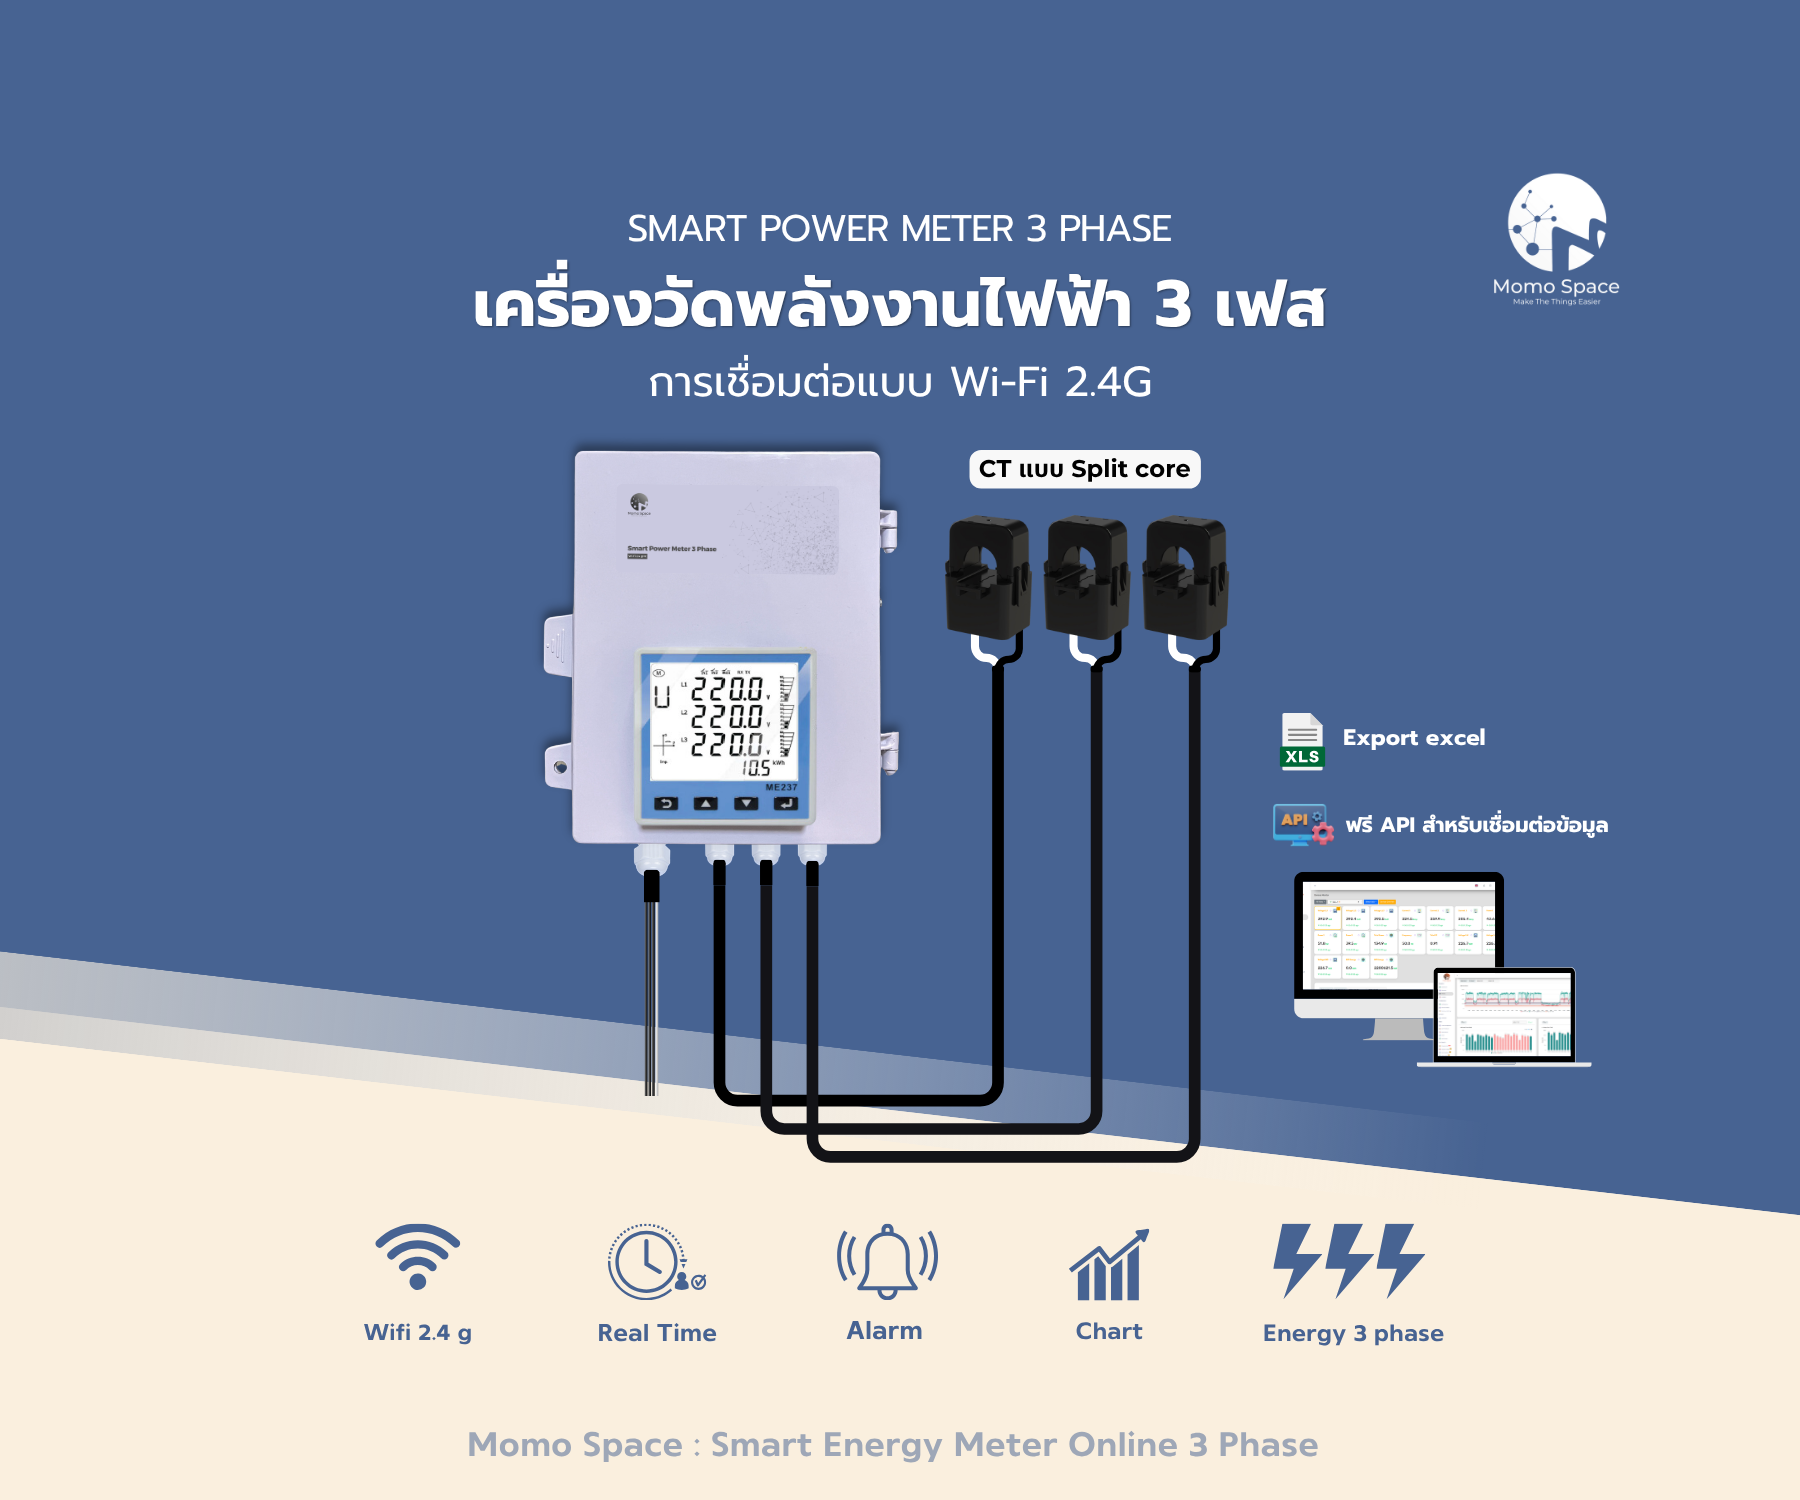
Three-phase digital power meter with clamp-style CTs (200/5A). WiFi 2.4 GHz with real-time dashboard and per-phase measurement.
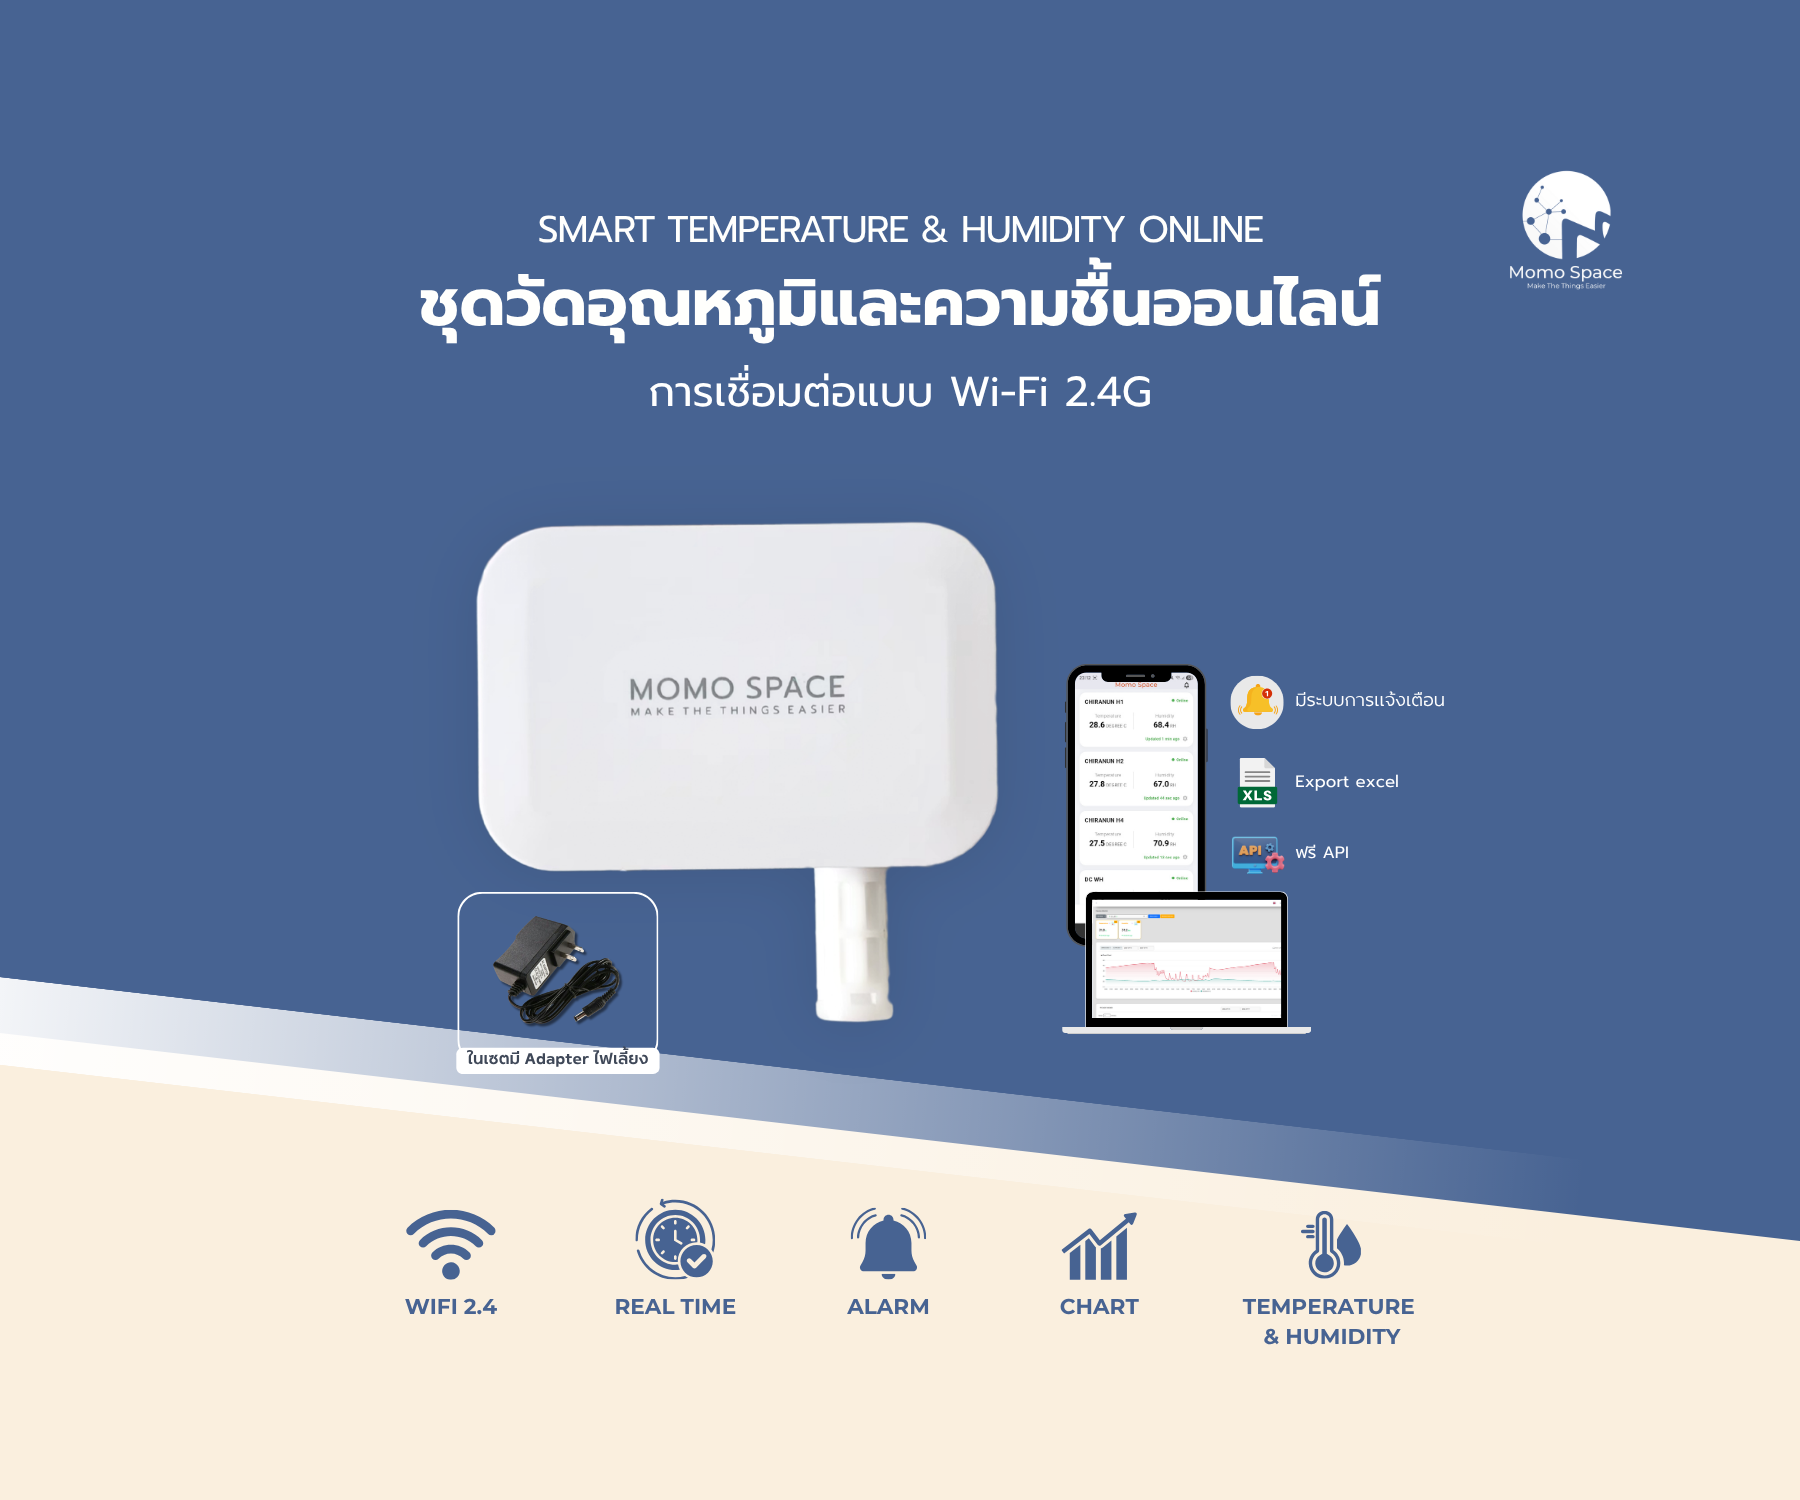
รายละเอียดสินค้า - การสื่อสาร : Wi-Fi ความถี่ 2.4 gHz - แรงดันไฟฟ้าการใช้งาน : 3 - 5 V - ช่วงการวัดอุณหภูมิ : -40 °C to 125 °C - ความแม่นยำของอุณหภูมิ : ±0.3 °C - ความละเอียดของอุณหภูมิ : 0.015 °C - ช่วงการวัดความชื้น : 0 - 100 %RH - ความแม่นยำของความชื้น : ±3.0 %RH - ความละเอียดของความชื้น : 0.01 %RH - ระดับการป้องกันหัวโพรบ : IP44 - ขนาด กว้าง 100 x ยาว 107 x สูง 34 มิลลิเมตร - การรับประกันสินค้า : 1 ปี - น้ำหนักอุปกรณ์ : 200 กรัม คุณสมบัติของระบบ - Dashboard เเสดงผล Realtime ค่าอุณหภูมิ ความชื้น - Chart เเสดงผลกราฟของ ค่าอุณหภูมิ ความชื้น ย้อนหลัง รายชั่วโมง รายวัน เเละรายเดือน - ระบบเเจ้งเตือนผ่าน Line เมื่อค่าทางไฟฟ้าเกินที่กำหนด (สามารถตั้งค่าเเละ Message Alarm ได้) - สามารถ Export ข้อมูลให้รูปของไฟล์ Excel
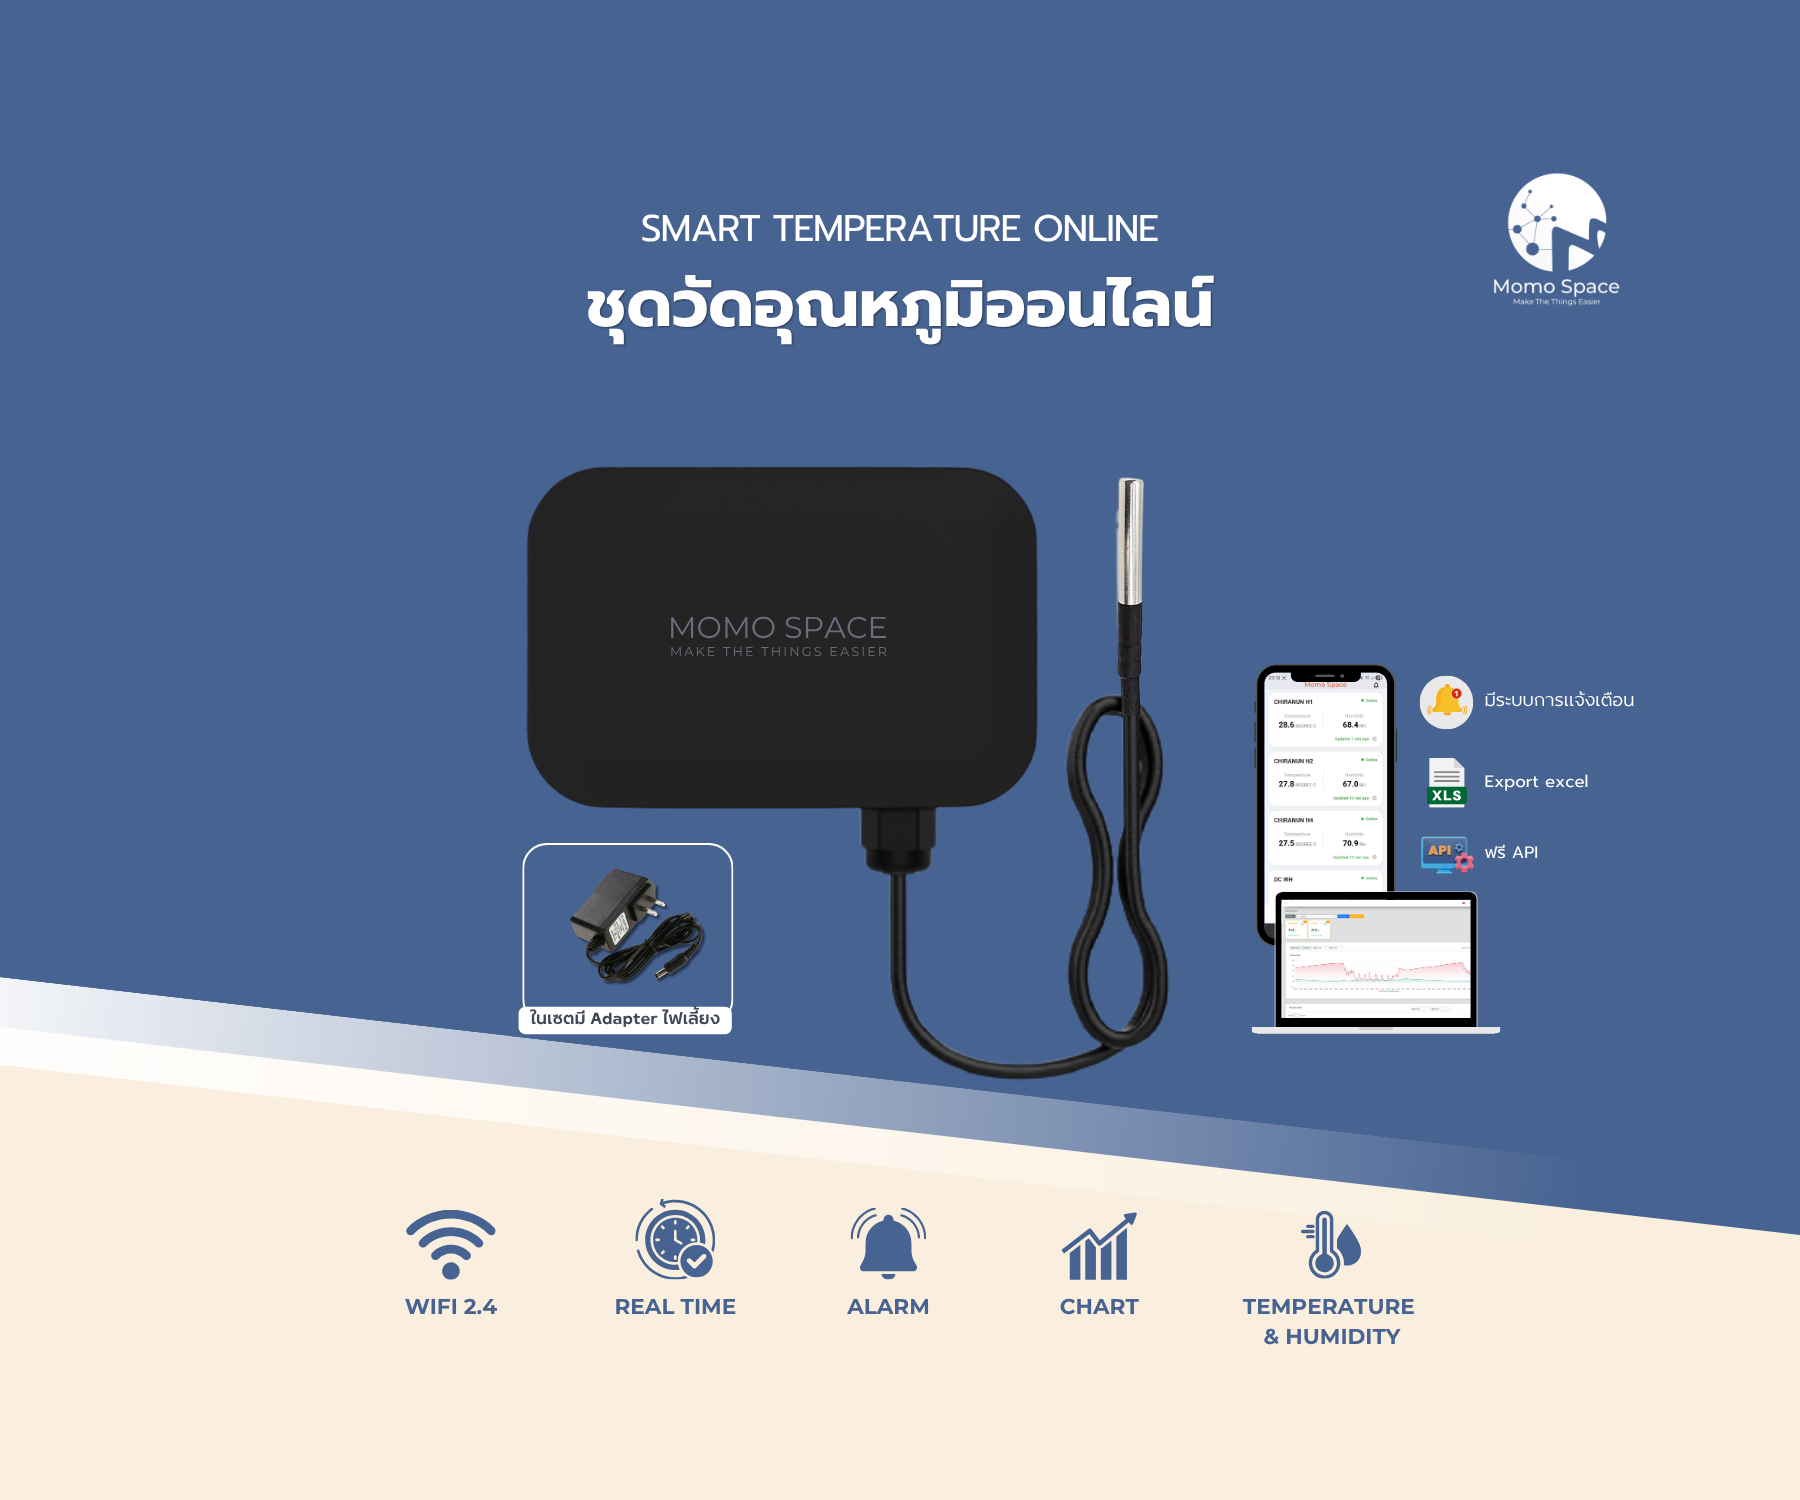
รายละเอียดสินค้า - การสื่อสาร : Wi-Fi ความถี่ 2.4 gHz - แรงดันไฟฟ้าการใช้งาน : 3 - 5 V - ช่วงการวัดอุณหภูมิ : -30 °C to +125 °C - ความแม่นยำของอุณหภูมิ : ±0.5°C (ในช่วง -10°C ~ +85°C) - ความละเอียดของอุณหภูมิ : 0.1 °C - วัสดุหัวโพรบ : สแตนเลสกันน้ำ - ความยาวหัวโพรบ : ~50 มม. - ความยาวสาย: 1, 3, 5, และ 10 เมตร (ความยาวปกติที่ 1 เมตร) - การรับประกันสินค้า : 1 ปี - น้ำหนักอุปกรณ์ : 200 กรัม (น้ำหนักเพิ่มขึ้นตามระยะของสาย) คุณสมบัติสินค้า - แดชบอร์ด เเสดงผล ค่าอุณหภูมิเรียลไทม์ - แผนภูมิ เเสดงผลกราฟของอุณหภูมิย้อนหลังรายการชั่วโมงรายวันและเดือน - ระบบเเจ้งเตือนผ่านไลน์เมื่อค่าอุณหภูมิเกินที่กำหนด (สามารถตั้งค่าเเละ Message Alarm ได้) - สามารถส่งออกข้อมูลให้รูปของไฟล์ Excel ได้อย่างปลอดภัย
From concept to mass production, we help system integrators and brands develop hardware, firmware and cloud in one stop.
Analyse the use case, draft requirements, design the architecture and produce the BOM.
PCB layout, 3D enclosure and firmware prototype, field-tested in real conditions.
Connect to the Momo Space cloud, build the dashboard UI and the API for your end customers.
Full production, QC, installation and training for your team until everything runs.
Not just components — we deliver hardware, firmware, cloud and dashboard carrying your logo and brand, ready to use on day one.
1P/3P meters, gateway and dashboard carrying your brand, installed and handed over as a turnkey system.
Temperature, humidity, PM2.5 and CO₂ sensors with a mobile app and cloud under your own brand identity.
Water level, pressure and quality sensors (pH/DO/EC) with cloud and dashboard under your brand — ideal for factories, dormitories and aquaculture farms.
A completed set designed around your brief, from PCB to cloud — low MOQ starting at 50 units with end-to-end support.
An experienced engineering team that looks after you from installation through to long-term system upgrades.
Install, configure and test every node, then hand over a full baseline report.
Annual maintenance agreement covering patches, updates, cloud sync and on-call support.
Hotline, LINE OA and remote diagnostics — most issues resolved within the hour.
Custom IoT devices, firmware and dashboards built to your requirements.
More than 250 projects, from large factories and office buildings to dormitories and cold storage — installed, commissioned and running in production.


Straight answers for teams evaluating Momo Space IoT Solutions.
Fill in the form and our engineering team will get back to you within 24 hours, with a free system demo.