EV Charging Station Billing
“Several charging sites, one electricity bill, and no way to tell which site spent what”
Rangsit has reported nothing for two hours, in a window that normally sees cars charging — worth sending someone to look at the unit
- Combined load across every site, against the peak you set
- Each site, with what it draws now and what it has used this month
- A status dot per site; one that has stopped reporting blinks
- The device rows name the meter and the board each figure comes from
Figures on this screen are illustrative; a real one shows readings from your own site.
What you see
- Someone drives to every site each month to read a meter, and one misread becomes a wrong invoice
- The electricity bill arrives as a single figure, with no way to split it by site
- A peak-demand penalty turns up with no clue which site caused it, or at what hour
What we do
A meter on the distribution board that feeds each charger, reporting to the cloud continuously. Every site on one screen, a monthly kWh figure per site exported ready to bill from, and a LINE alert when load approaches the peak you set.
How it works
Energy, demand and voltage where the board feeds the charger
Collects every meter at that site, and buffers readings through an outage
Hosted in Thailand, every site in one store, backed up daily
Compare site against site, and look back over any period
Split by site and exported to Excel, ready to drop into an invoice
LINE when load nears your peak, or when a site's meter goes quiet
What it does
Daily and monthly kWh for every site, read automatically, with nobody sent out to a meter.
What each site is drawing right now, and what they draw together.
Set a peak figure per site; LINE tells you as it approaches, and a person decides what to do.
Download the month split by site instead of adding meter readings up by hand.
See which site works hard and which sits idle, and use it when choosing the next location.
If a site stops reporting when it should not, you know within minutes rather than from a complaint.
Against the logbook
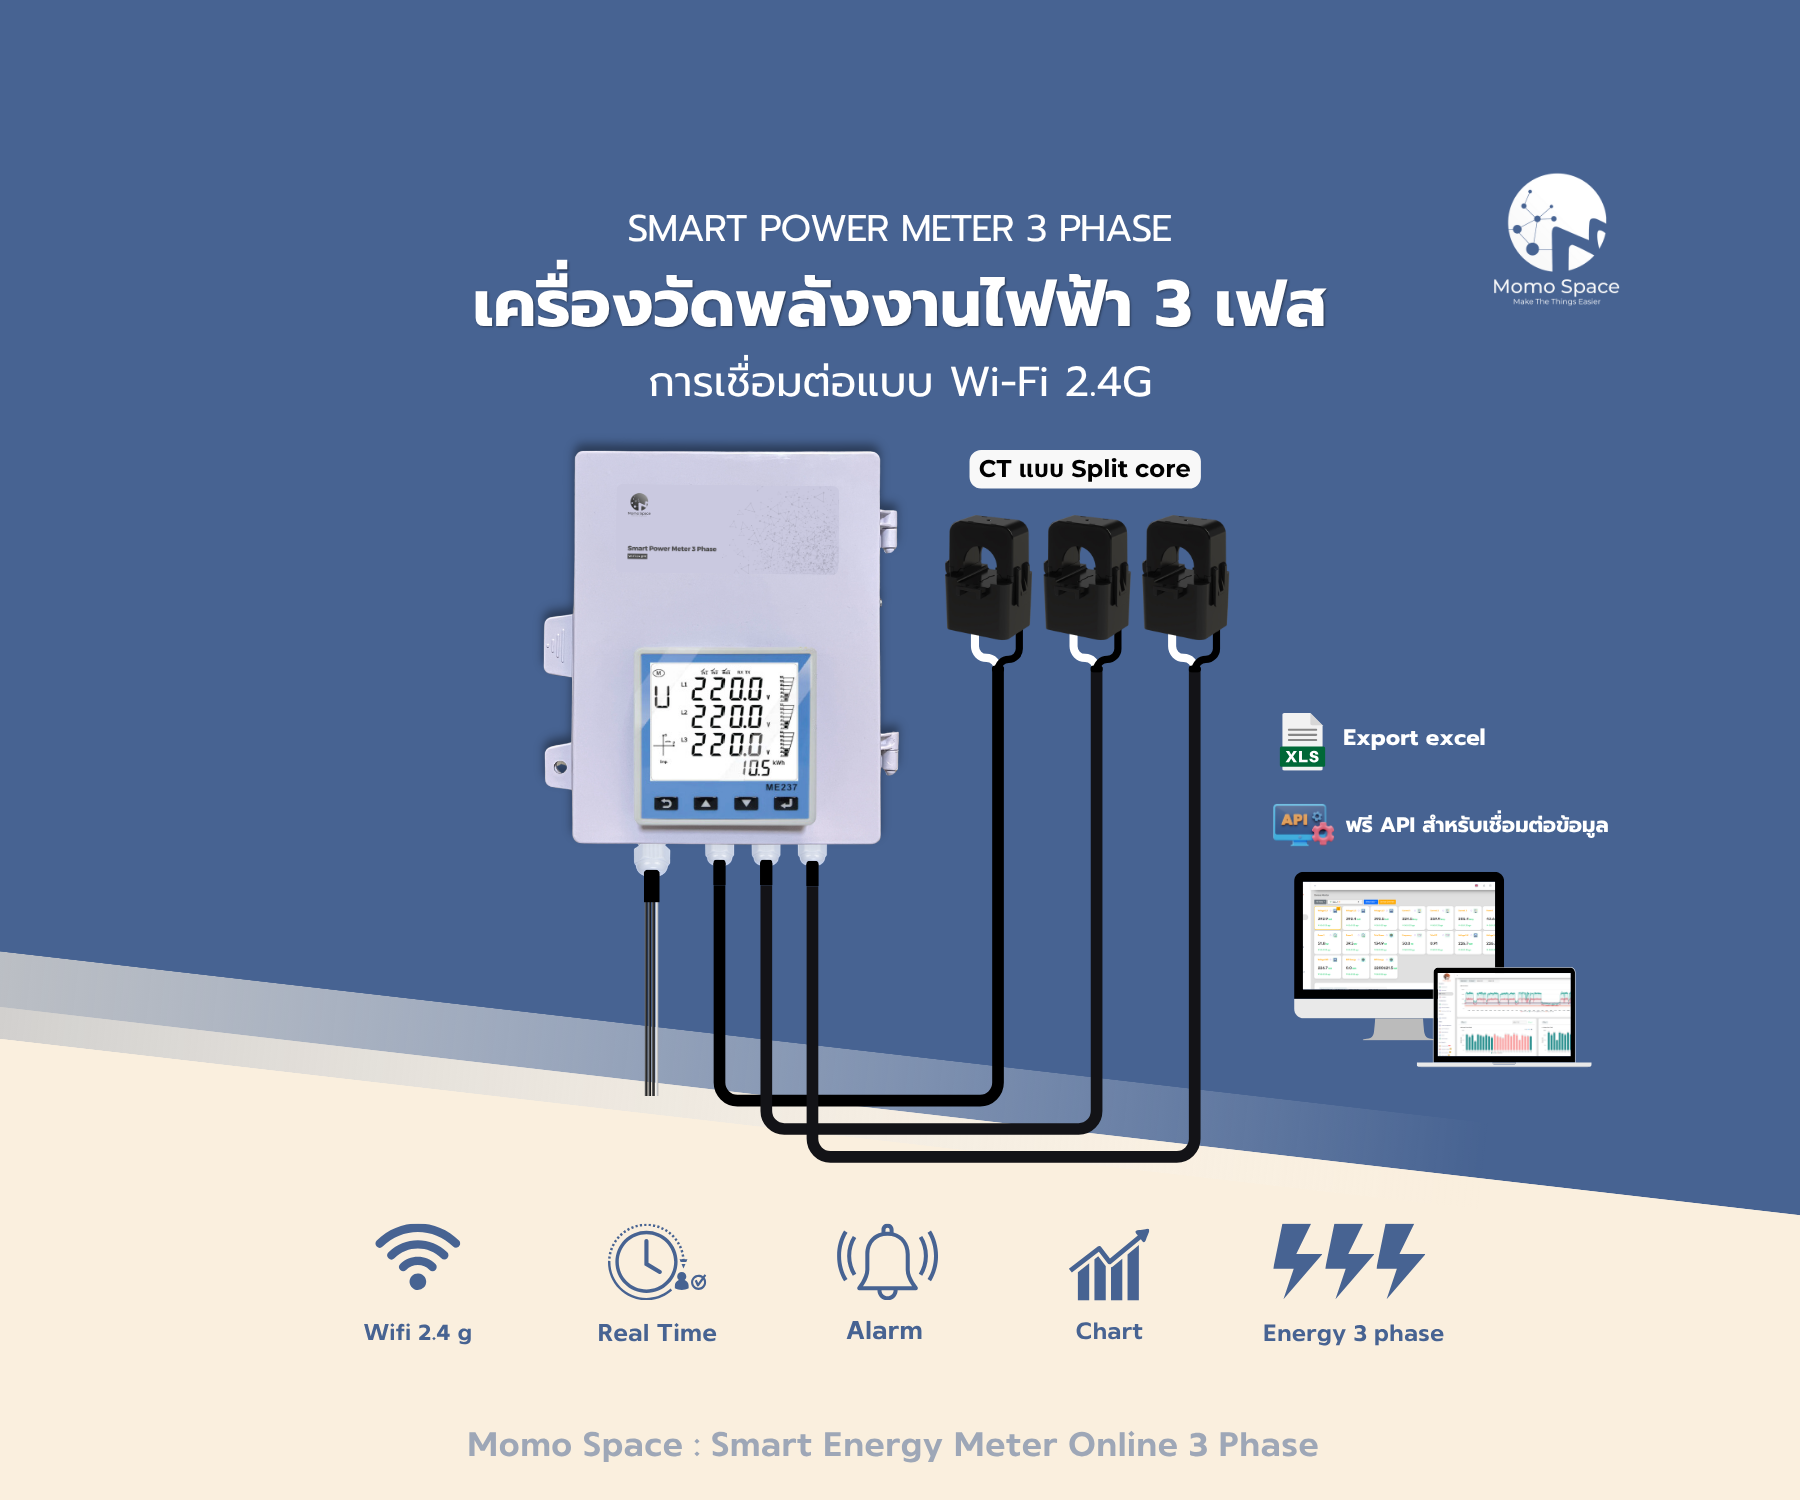
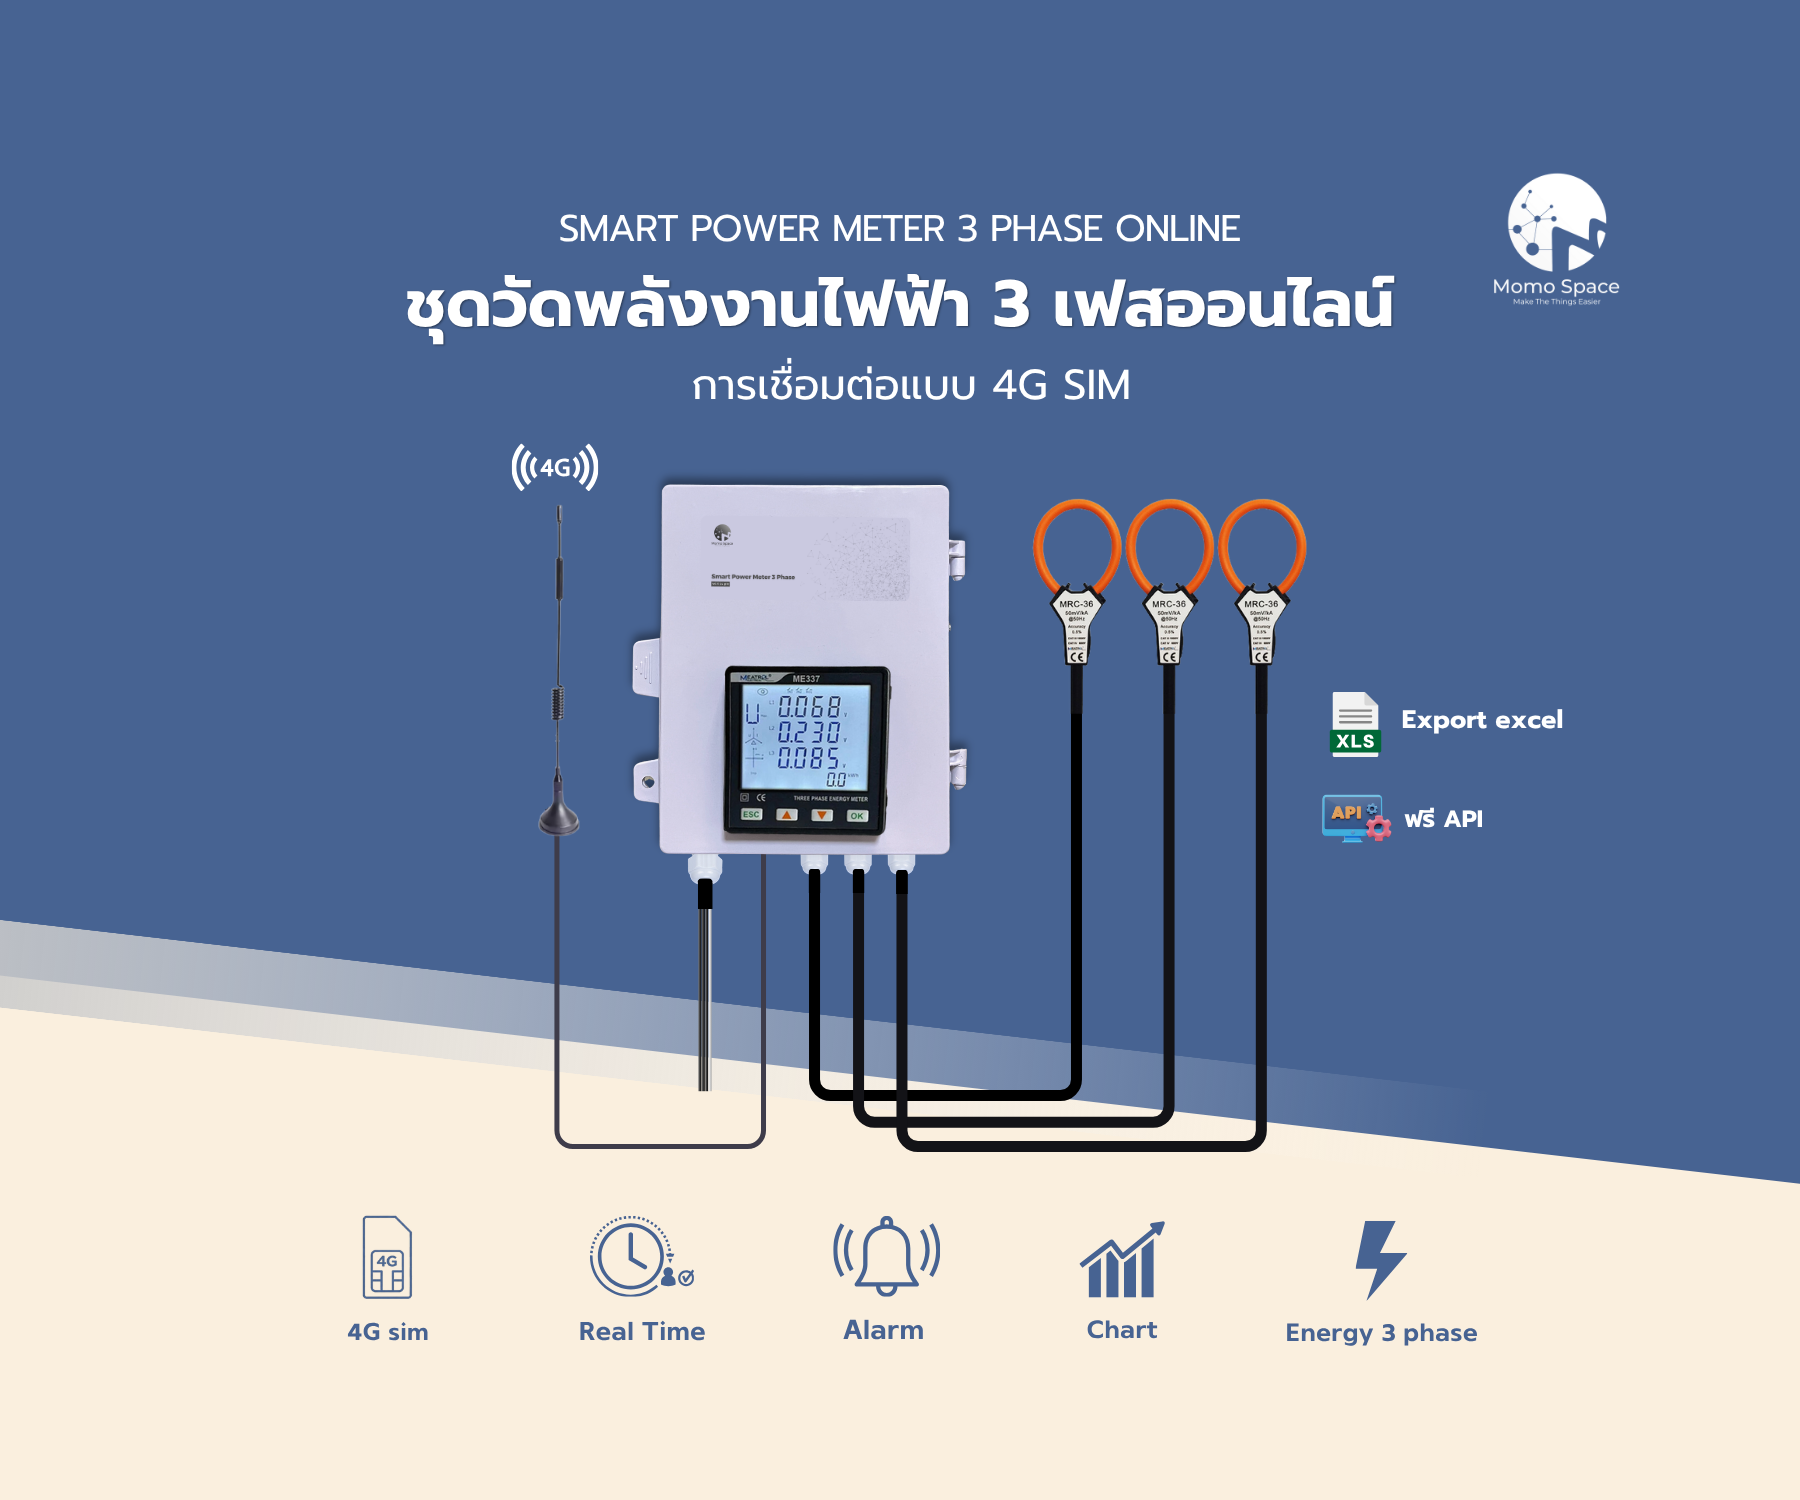
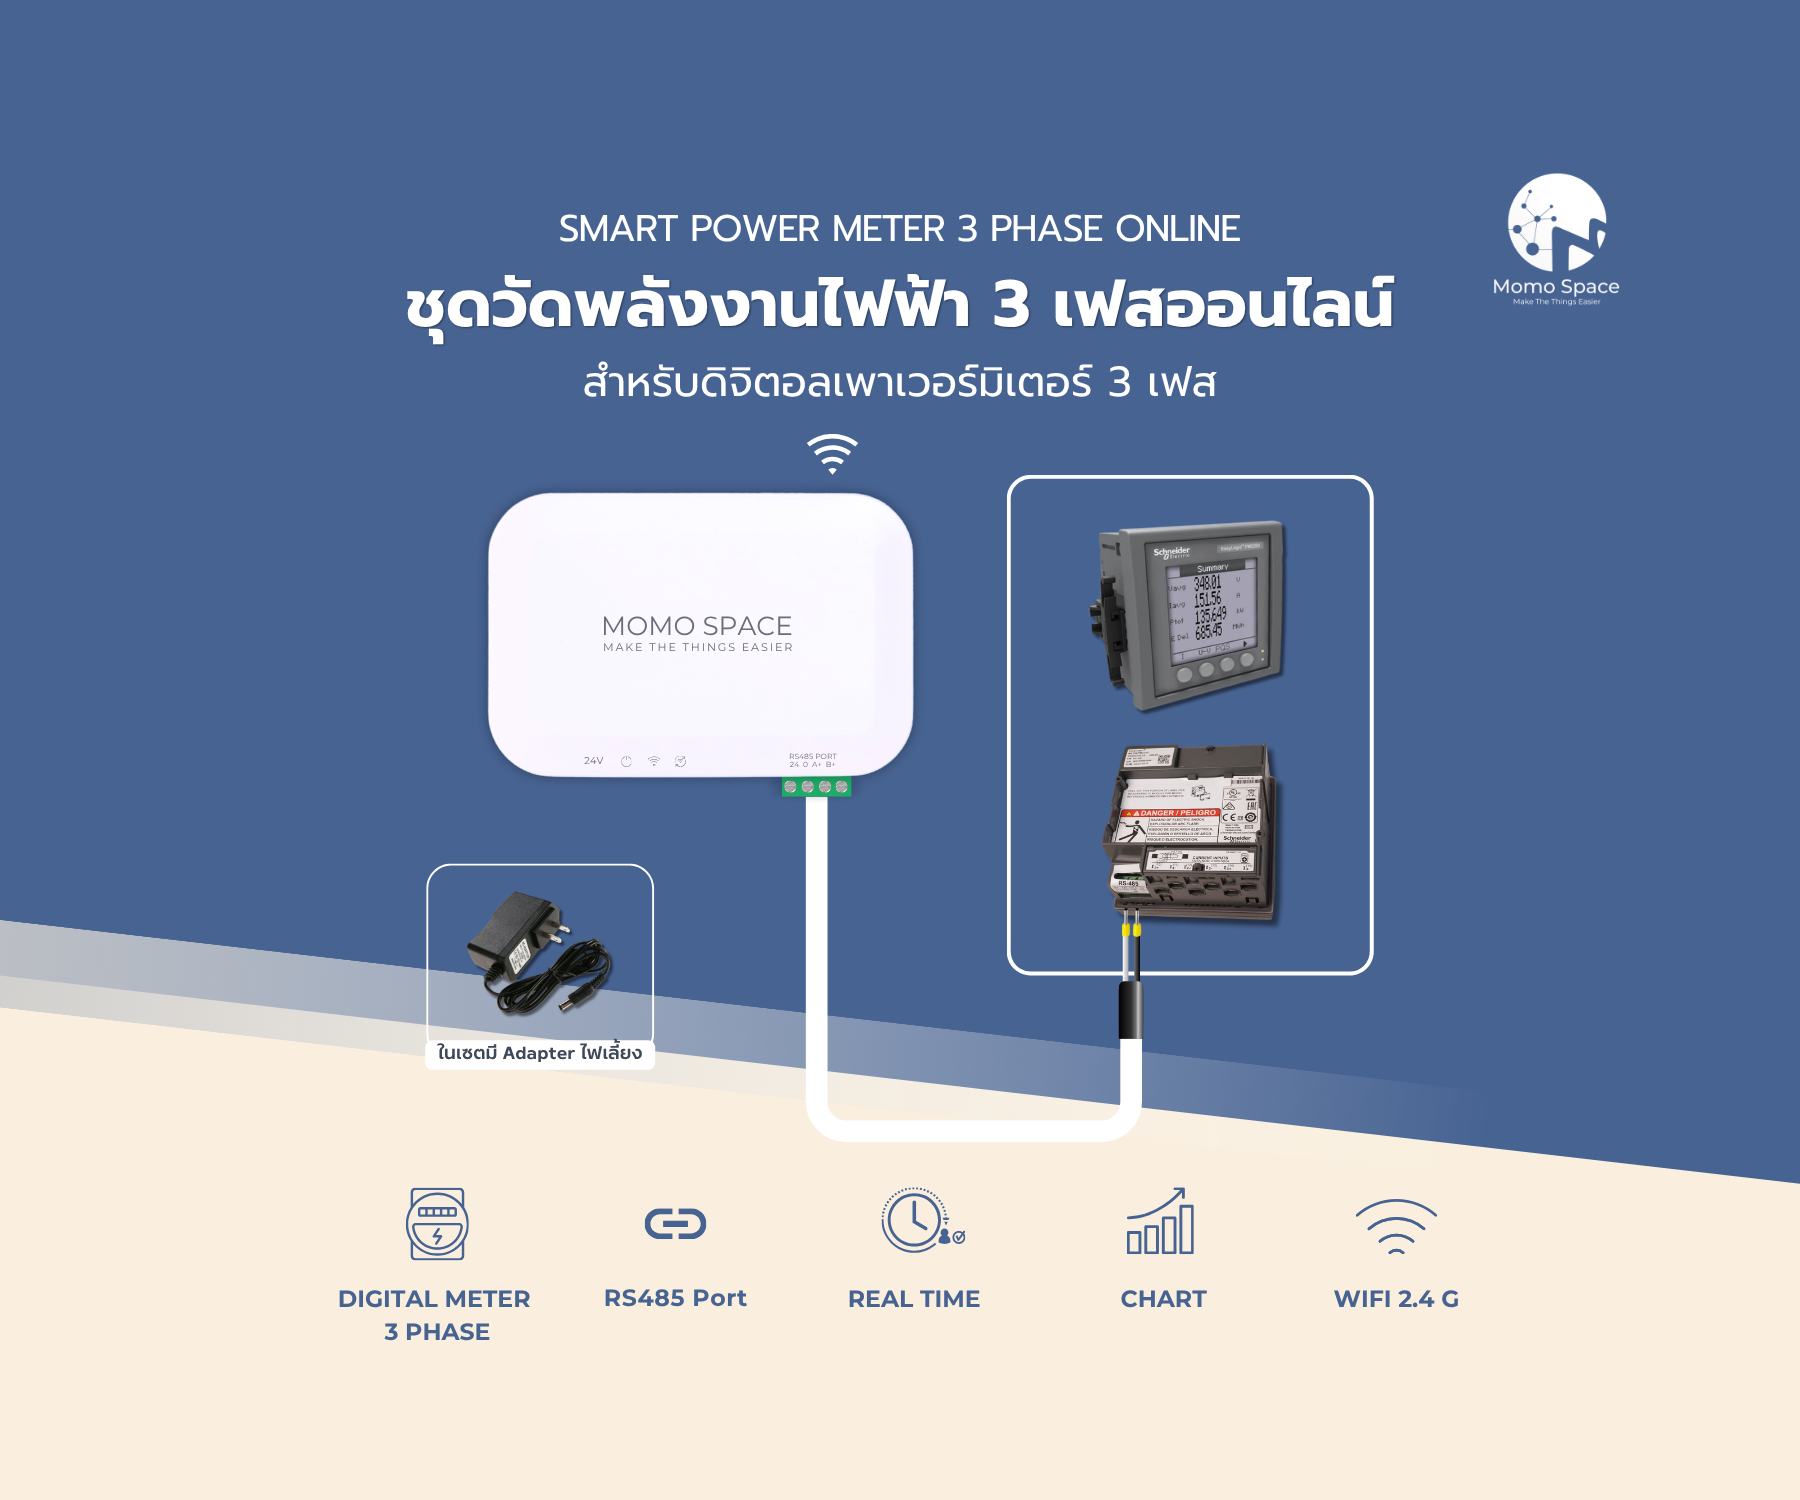
Devices used in this system
Prices are per set; how many you need depends on the site.
Where it fits
Download the per-site kWh and bill straight from it
Put each site's energy cost against that site's revenue
Look back site by site and find where the extra units went
Set the peak and get warned before you reach it
A meter goes quiet out of hours and the system says so
Size the new transformer from what existing sites really draw
How we work with you
- 01Survey the boards
How many feeders each site has, their rating, and where a meter and CT can go.
- 02Install and connect
Meters and gateway in at every site, then tested until all of them report to the cloud.
- 03Set peaks and recipients
A peak figure for each site, and the LINE group that will hear about it.
- 04Hand over and maintain
Training, the first month's export reviewed together, then annual care of the system.
Related documents
Questions about this system
Does it connect to the charger itself?
No. We meter the distribution board that feeds the charger, so you get the site's total energy — not per-session or per-user data from the unit. That level of detail comes from the charger manufacturer's own system.
Do you collect payment from drivers?
No. You get per-site figures and an export ready to bill from; invoicing and collecting payment stay with you.
Will it throttle charging as a site nears its peak?
No — it warns you, and a person decides what to do. We do not send commands to a charger.
What happens if a site loses its internet connection?
Nothing is lost. The gateway buffers readings on site and backfills them to the cloud when the link returns.