Production Line Climate
“Humidity out of spec, found out when the batch is rejected”
Zone C passes 65 %RH every afternoon after the loading door opens — start the dehumidifier from 12:30
- Zones in production order, with their current temperature and humidity
- A zone over its limit is highlighted and flashes first
- Related equipment, such as a dehumidifier, with its schedule
- The shift report the system sends by itself
Figures on this screen are illustrative; a real one shows readings from your own site.
What you see
- Parts, packaging or raw materials damaged by high humidity
- Some zones run hotter and damper than others, with no data to show it
- A customer or auditor asks for climate records from production, and there are none
What we do
Temperature and humidity sensors zone by zone along the line, live on the dashboard, a LINE alert when a reading crosses its threshold, and scheduled reports by email.
How it works
Temperature and humidity per zone along the line and in raw-material stores
Collects the whole line and sends it up over WiFi or a BLE gateway
Per-zone history on servers in Thailand, PDPA-compliant
Momosight finds the hours humidity repeatedly runs high and ties them to what happens on the floor, like the loading door opening
Every zone at once, and shift-to-shift comparison
LINE when a zone crosses its limit, and a shift report by email
What it does
Each zone holds its own range, instead of one figure for the whole plant.
An early threshold gives the team time to correct conditions.
Each shift summarised and emailed automatically, ready for the production file.
Answer a customer or an auditor about conditions while a batch ran.
Readings can drive a dehumidifier or extraction fan, or run them on a schedule.
Seen together from one place, with access by plant.
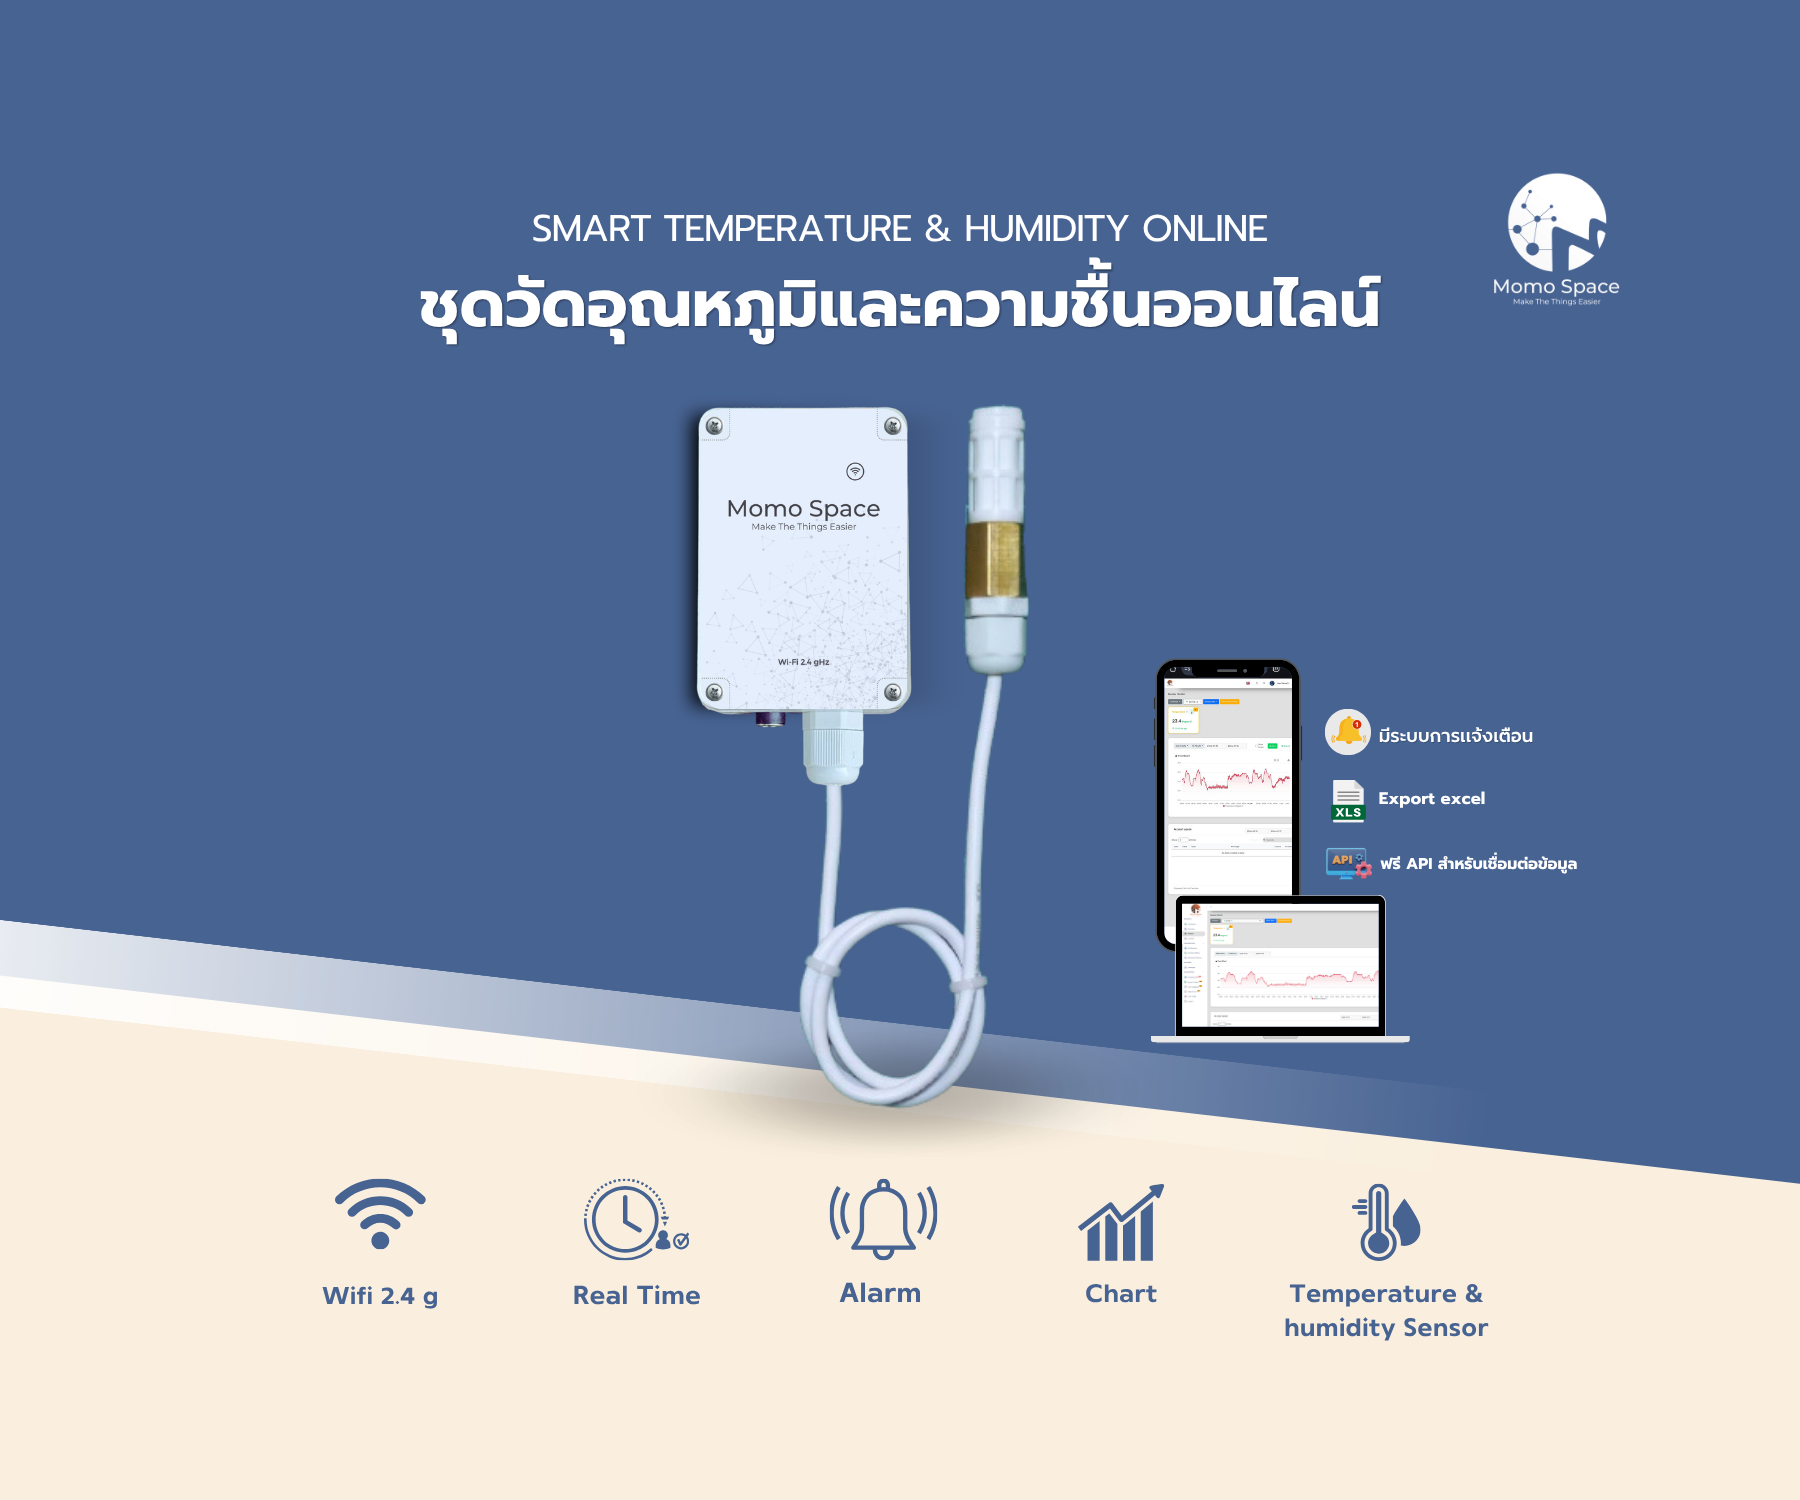
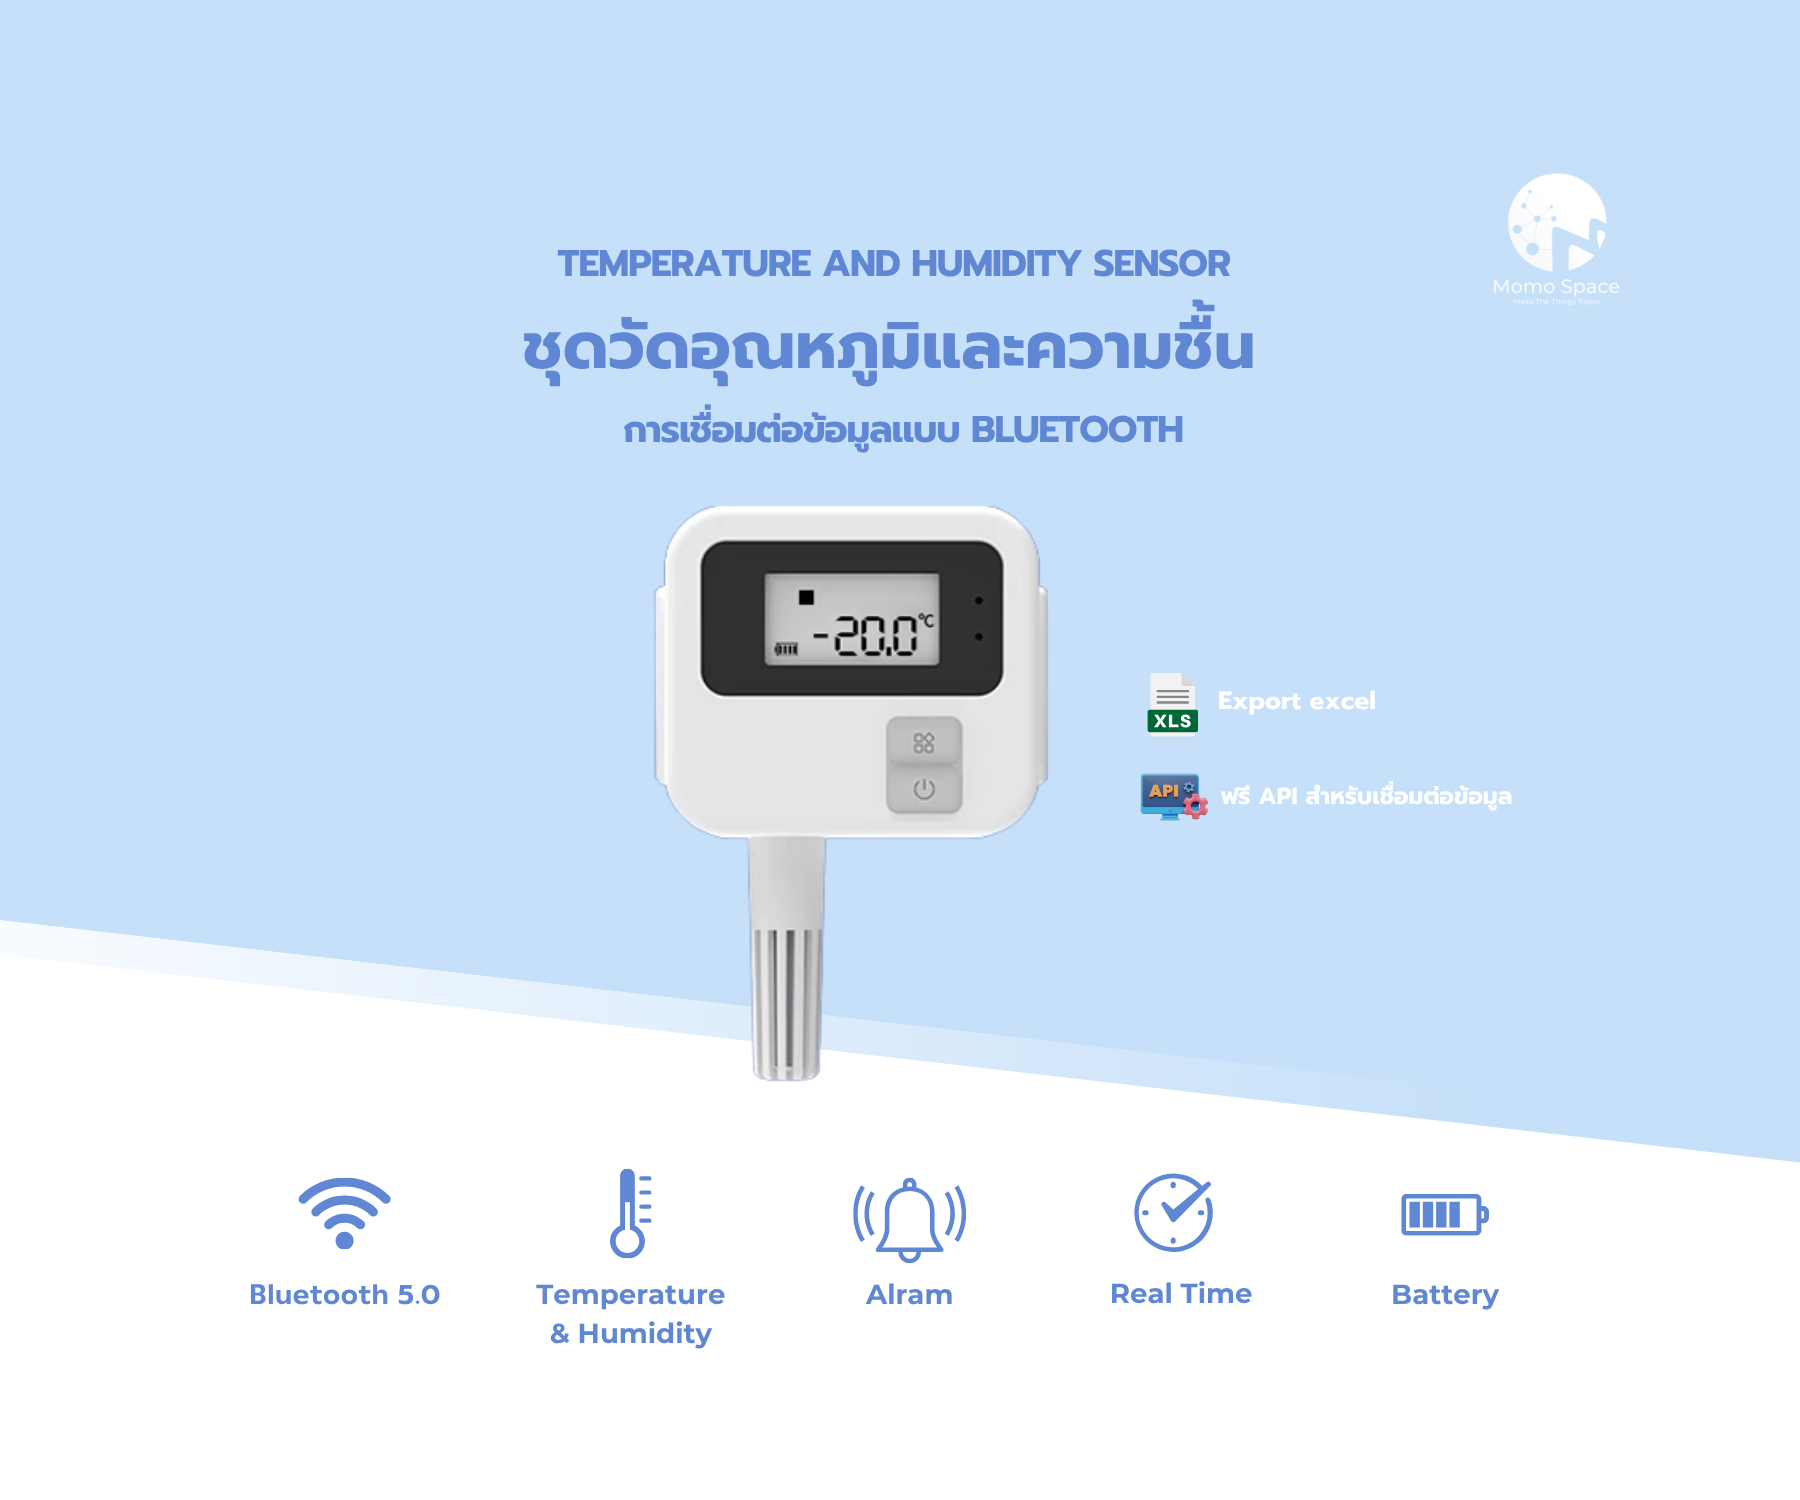
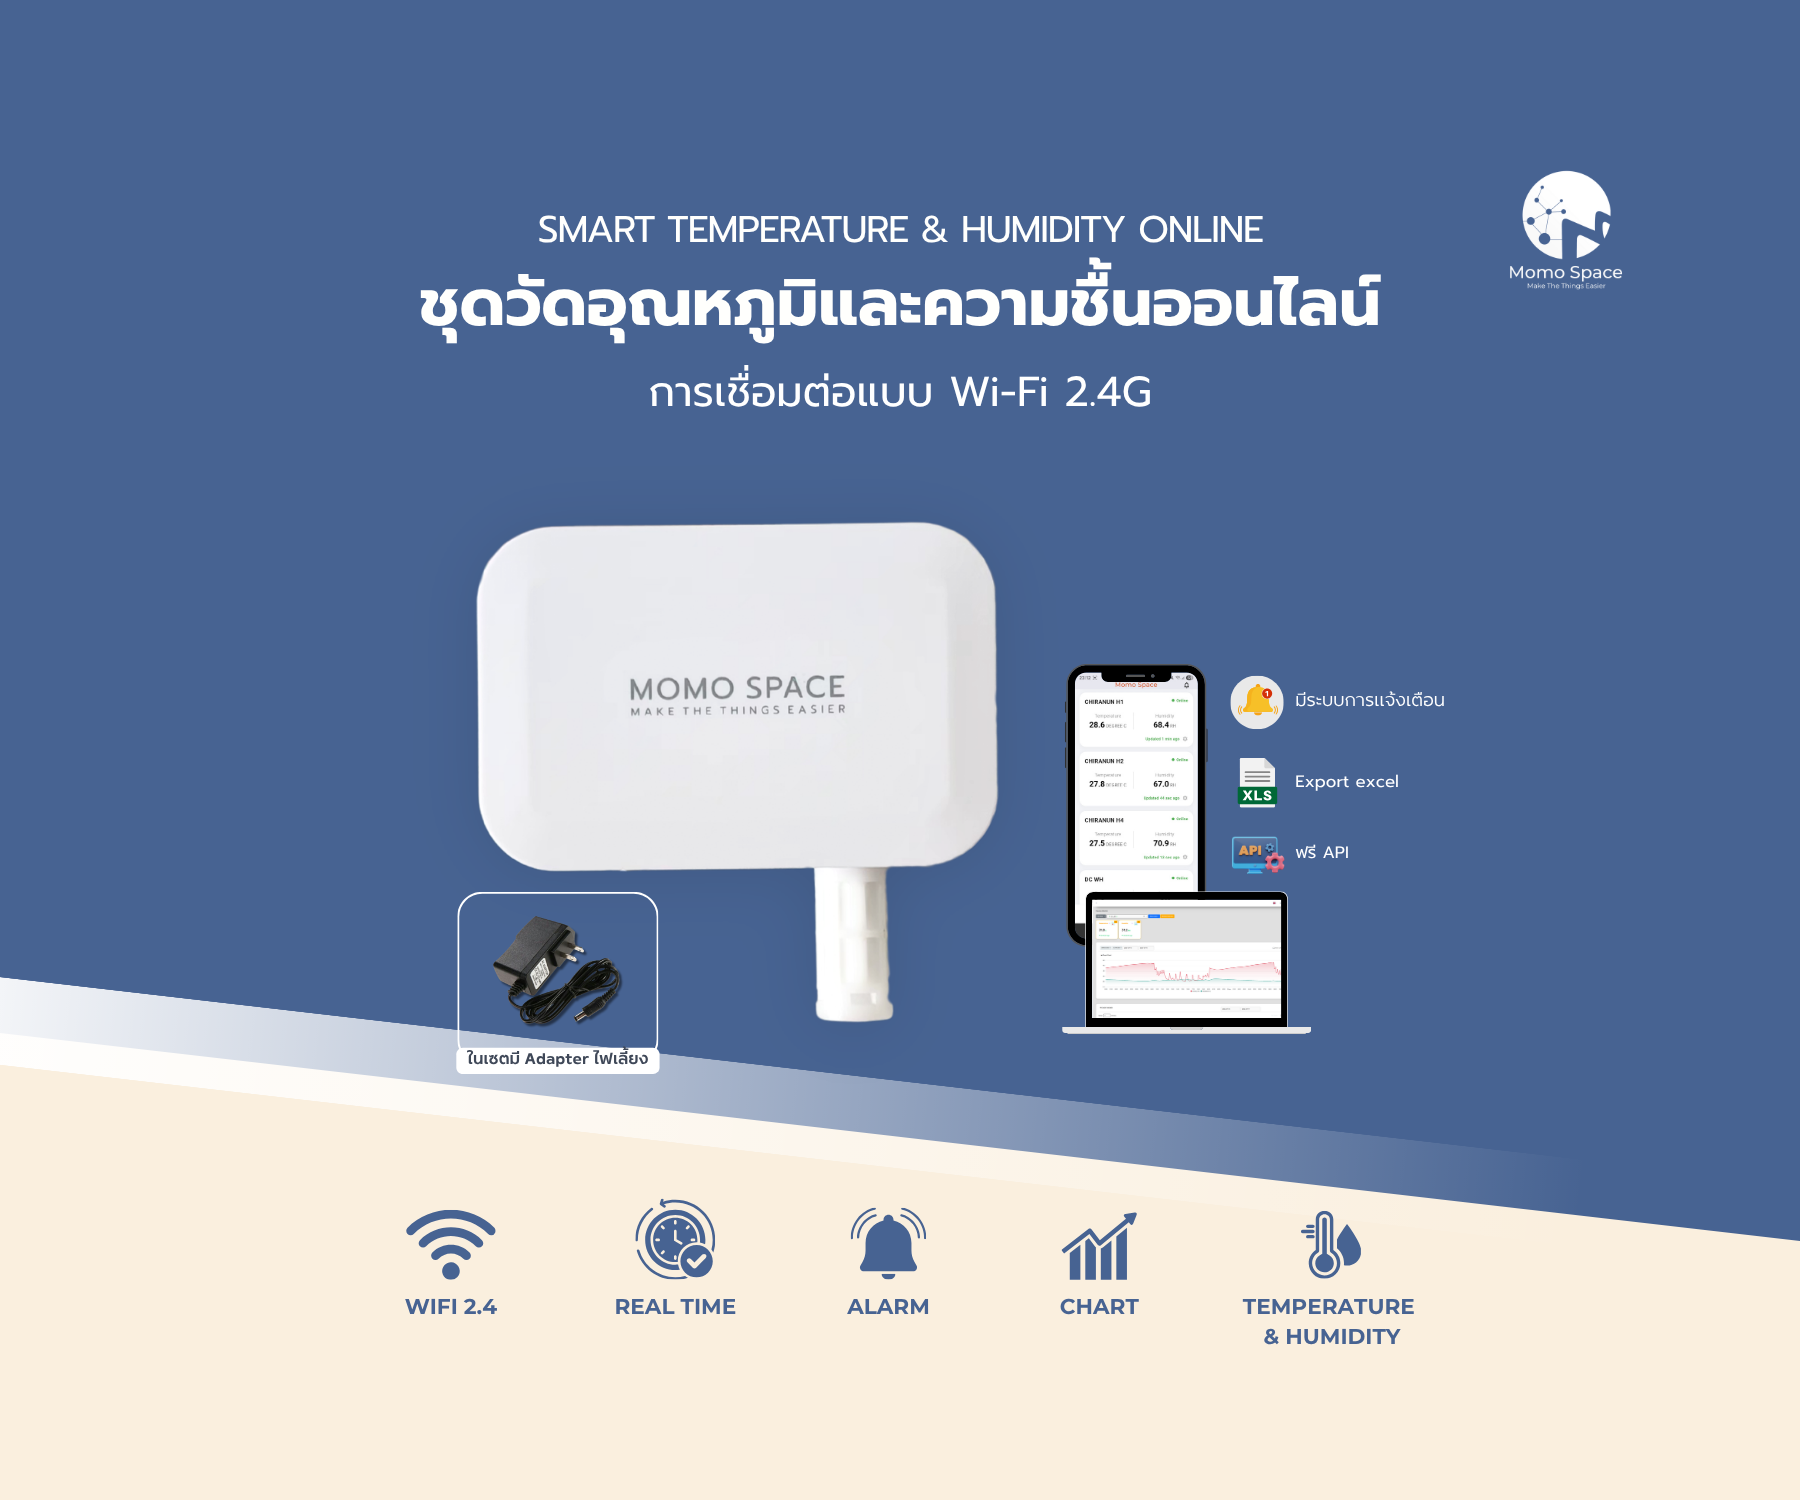
Devices used in this system
Prices are per set; how many you need depends on the site.

Where it fits
Parts sensitive to humidity
Preparation and packing rooms
Areas held within a range
Paper and film that move with humidity
Stock kept at temperature
Conditions recorded through a test
How we work with you
- 01Survey the line
Divide it into zones, find where readings actually move, agree each zone's range.
- 02Install and check
Sensors fitted by zone, readings checked against a reference instrument.
- 03Limits and report schedule
Ranges per zone, the shift leaders' LINE group, and when reports go out.
- 04Support afterwards
Annual MA, with recalibration on the agreed cycle.
Related documents
Questions about this system
Can it go in dusty or damp areas?
There are IP44-rated versions against dust and splashes. For harsher areas our engineers choose the mounting point and an enclosure to suit.
Can the data support an audit?
Yes — continuous records, exported to Excel or PDF charts for any period, with calibration and certificates available if they are required.
Can it run the dehumidifier automatically?
Yes, where the equipment accepts a control signal or can be switched through a relay; readings then drive it, or it runs on a schedule.
How many points per line?
It depends on the length and how many zones have different conditions. Most start with one point per zone where readings move most, then add more once the data shows where.