Smart Building
“No idea which floor uses the power, and it stays on after hours”
From the site to the screen
The same figures on both sides: on the left the kit in the building, on the right the screen your team opens.
Tap a point on the drawing to see what it does
More to save today — hold 2F Retail at 26 °C and dim to 45% after 18:00
- Energy floor by floor, ordered so the heaviest floor right now stands out
- Rooftop solar shown as generation, set against what the building draws
- Controllable devices — VRF air-conditioning, lighting, EV chargers — with their current state
- The AI note: what to change tonight, and roughly what it saves
Figures on this screen are illustrative; a real one shows readings from your own site.
What you see
- A high total bill with no way to split it by floor or by tenant
- Air-conditioning and lights left running after everyone has gone
- Someone has to walk each floor to switch things off
What we do
A SCADA screen showing energy floor by floor, with devices switched on and off and scheduled from that one screen.
How it works
Fitted in each floor's panel, measuring energy, current, voltage, and climate in common areas
Collects readings from meters of any brand over Modbus and sends them to the cloud
History kept on servers in Thailand, PDPA-compliant, with daily backups
Momosight reads the stored history, compares it with how the building usually behaves, flags what is off and says what to change first
A SCADA screen floor by floor, live and historical on every point, carrying the AI's note
Switch devices, set schedules, and get a LINE alert the moment something is off
What it does
Sub-meters in each floor's panel show what every area actually used, instead of apportioning by floor area.
Air-conditioning, lighting and pumps controlled from one screen, on schedules for working days and holidays.
Warns on overload, abnormal readings or a device that has dropped off the network — no one has to watch a screen.
Shows the peaks that inflate the bill and warns before power factor slips into a kVAr penalty.
Daily and monthly summaries emailed on your schedule, ready for accounting or tenant charges.
Teams running several buildings see every site from one place, with access by role.
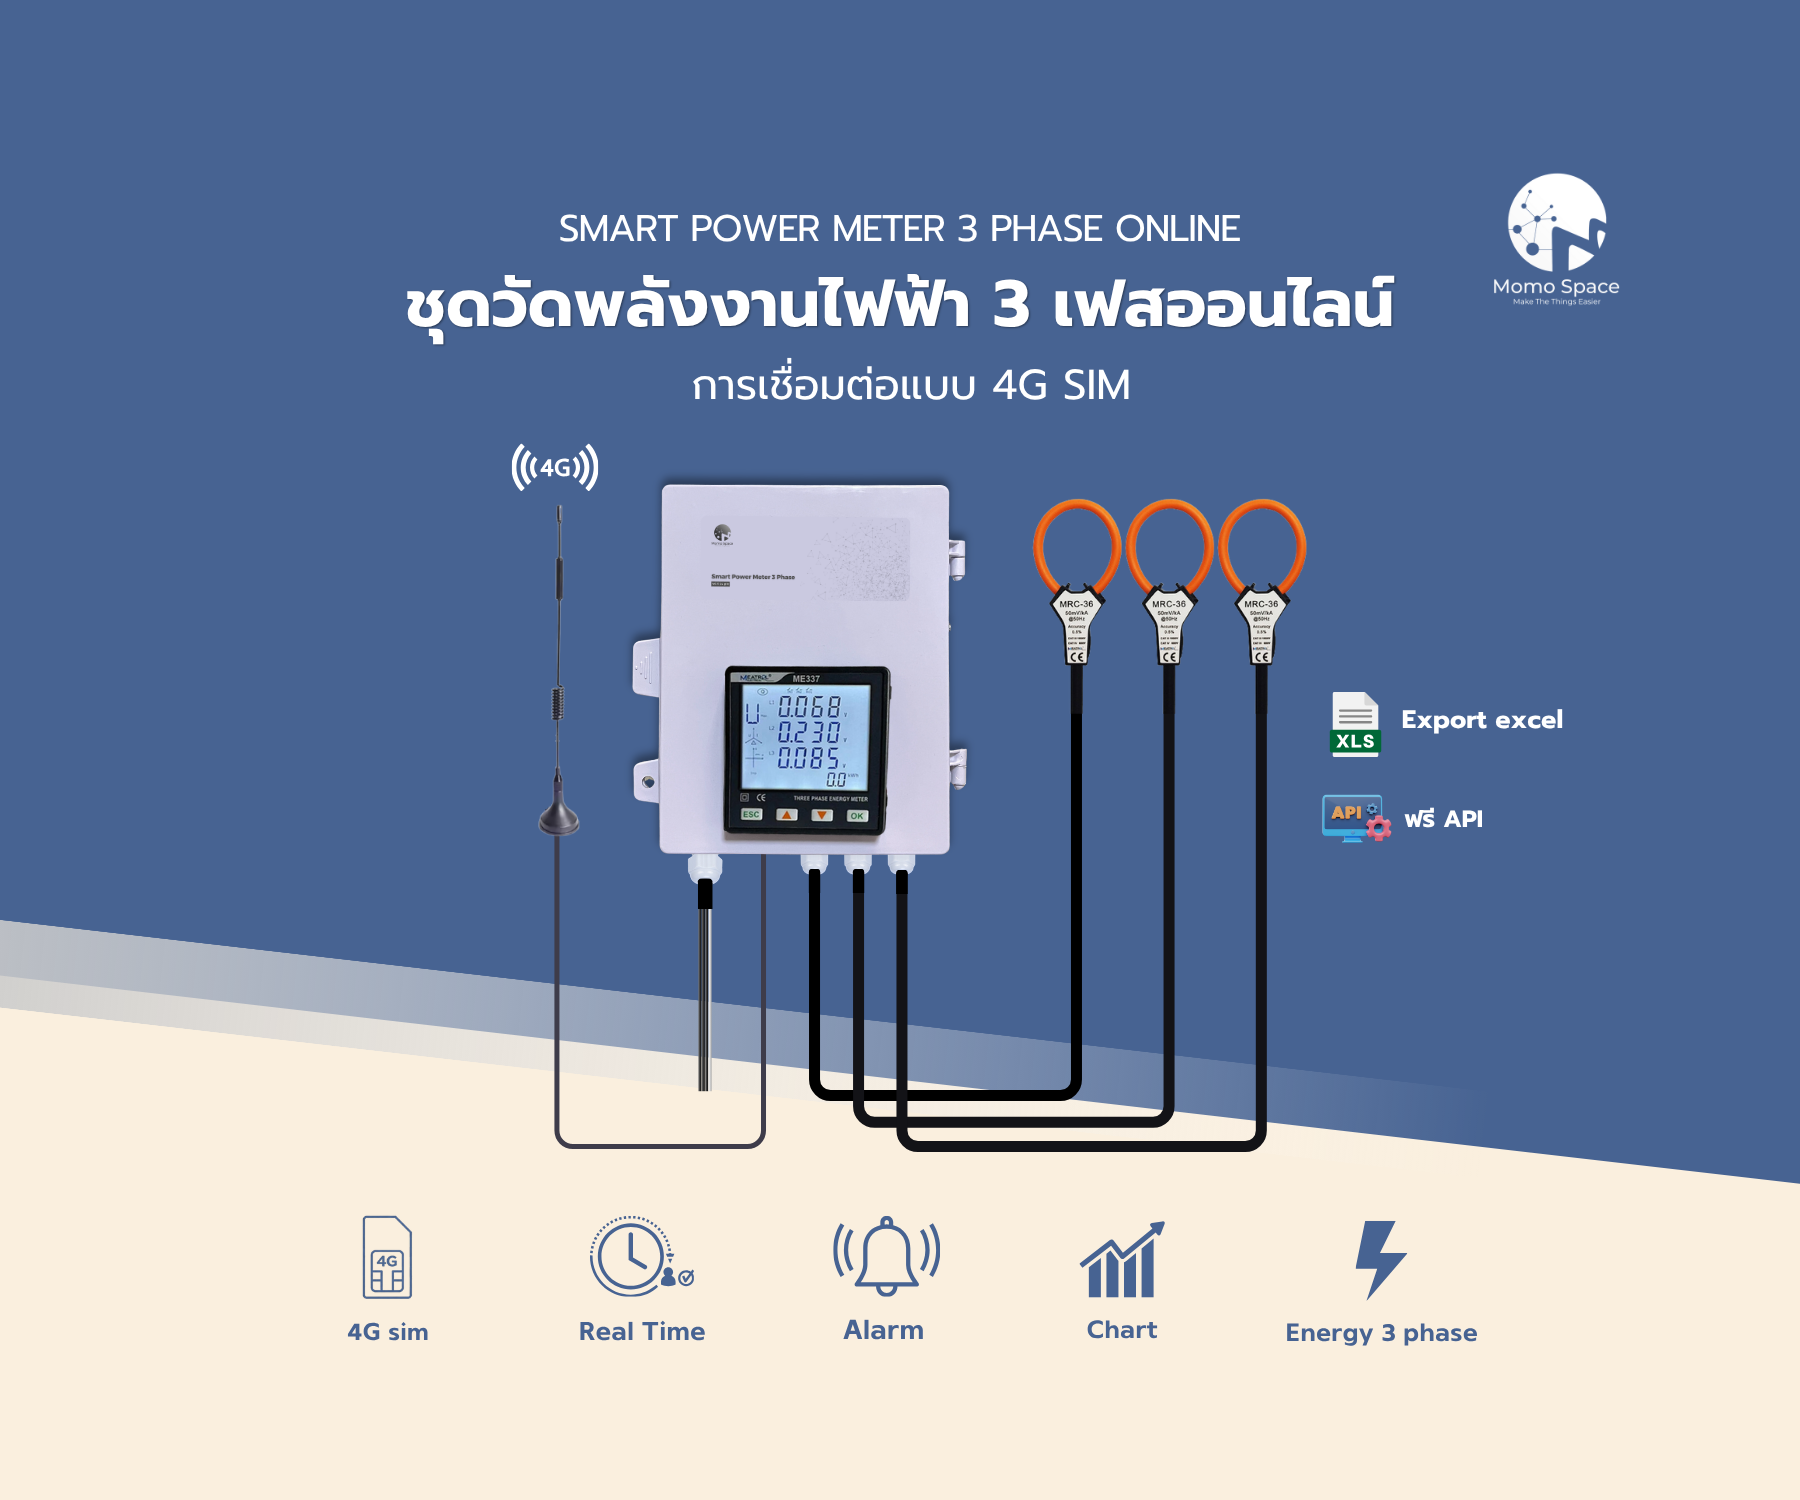
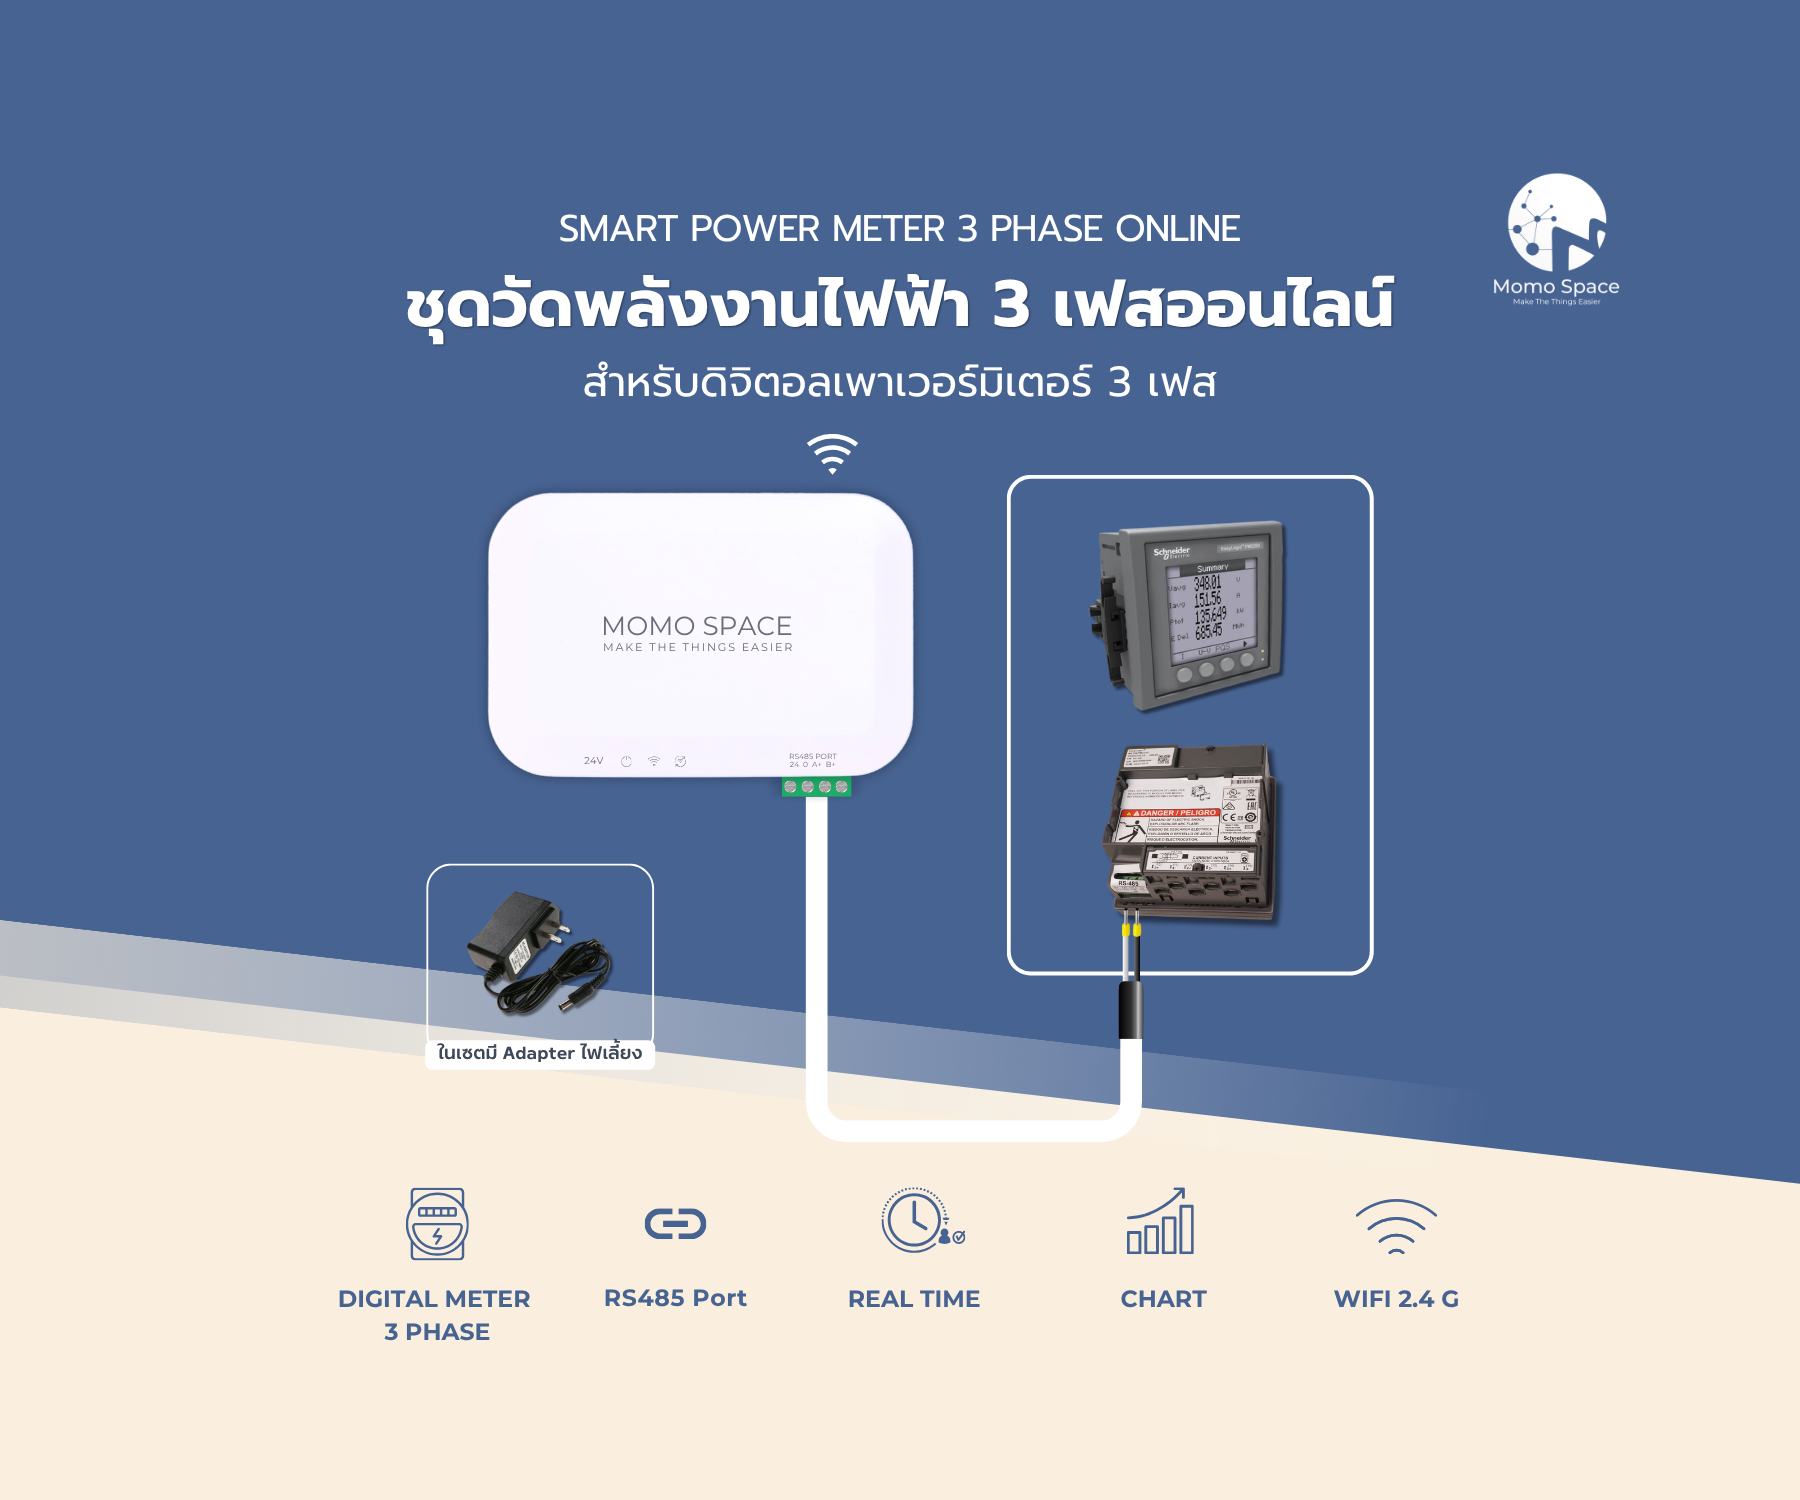
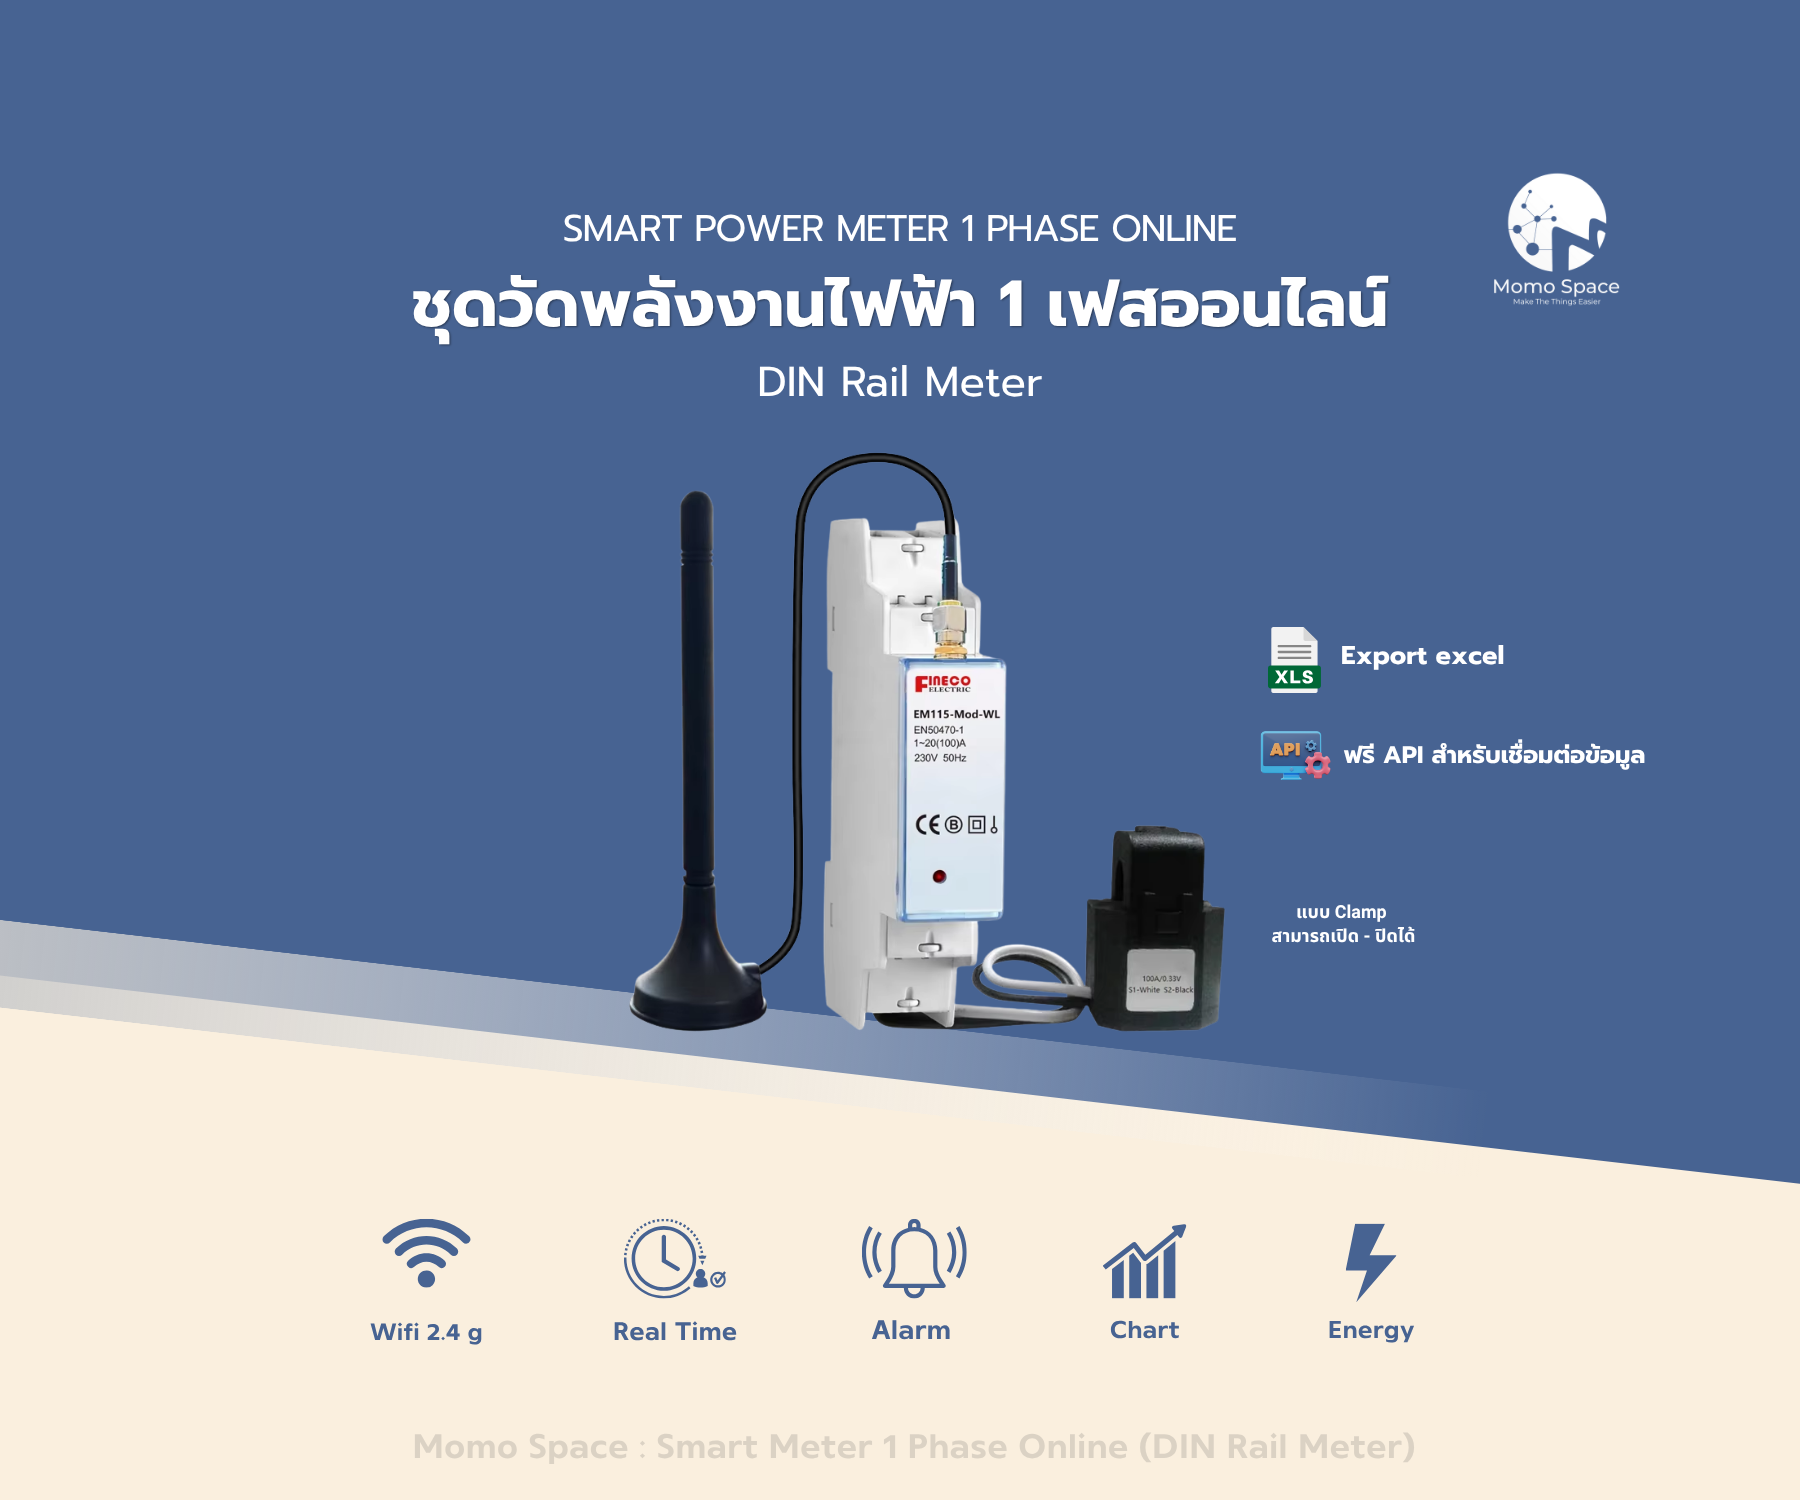
Devices used in this system
Prices are per set; how many you need depends on the site.

Where it fits
Per-tenant consumption, and fewer arguments about shared power
Air-conditioning and lighting on the shops' opening hours
Devices off automatically after classes, consumption split by building
Main panel load and critical-area climate watched around the clock
Charger consumption, kept under the transformer's limit
How we work with you
- 01Site survey
We look at the panels, the floors and the meters already there, then agree the points and the device count.
- 02Install and commission
Our engineers fit the CTs and signal wiring, then check readings against the existing meters.
- 03Set up screens and alerts
Screens arranged around how the building runs, with thresholds and the engineering team's LINE group.
- 04Support afterwards
Annual MA, remote and on-site support, and platform updates as they ship.
Related documents
Questions about this system
Do we have to shut the whole building down to install it?
No. Split-core and Rogowski CTs clamp around the cable without cutting it. Usually only the panel being worked on is switched off briefly, and the work can be booked outside office hours.
Can it use the meters the building already has?
Yes, if they speak Modbus RTU/TCP. Mspace V2 reads them into the system, so there is no need to replace every meter in the building.
What connections does it support?
There are WiFi 2.4GHz models and 4G SIM models; panels where WiFi doesn't reach usually take the 4G version.
Can we bill tenants with it?
It separates consumption by zone or tenant and keeps the history for reporting, which supports billing. For bills issued automatically and sent to tenants over LINE, see Dormitory Management.