Solar Site Assessment
“How many kW of solar is worth installing? Not without the real load”
Daytime load averages 128 kW and holds steady from 09:00 to 16:00 — about 120 kWp suits it, with roughly 92% used on site rather than exported
- Hourly load across the day; the shaded band is when solar can produce
- Average daytime load — the figure the sizing follows
- The array size the system calculates from the measured load
- The share expected to be used on site rather than exported
Figures on this screen are illustrative; a real one shows readings from your own site.
What you see
- The bill gives a monthly total, not what the site uses during daylight
- Every solar vendor proposes a different size, with no way to judge
- Fear of generating more than the site consumes, exported at a poor rate
What we do
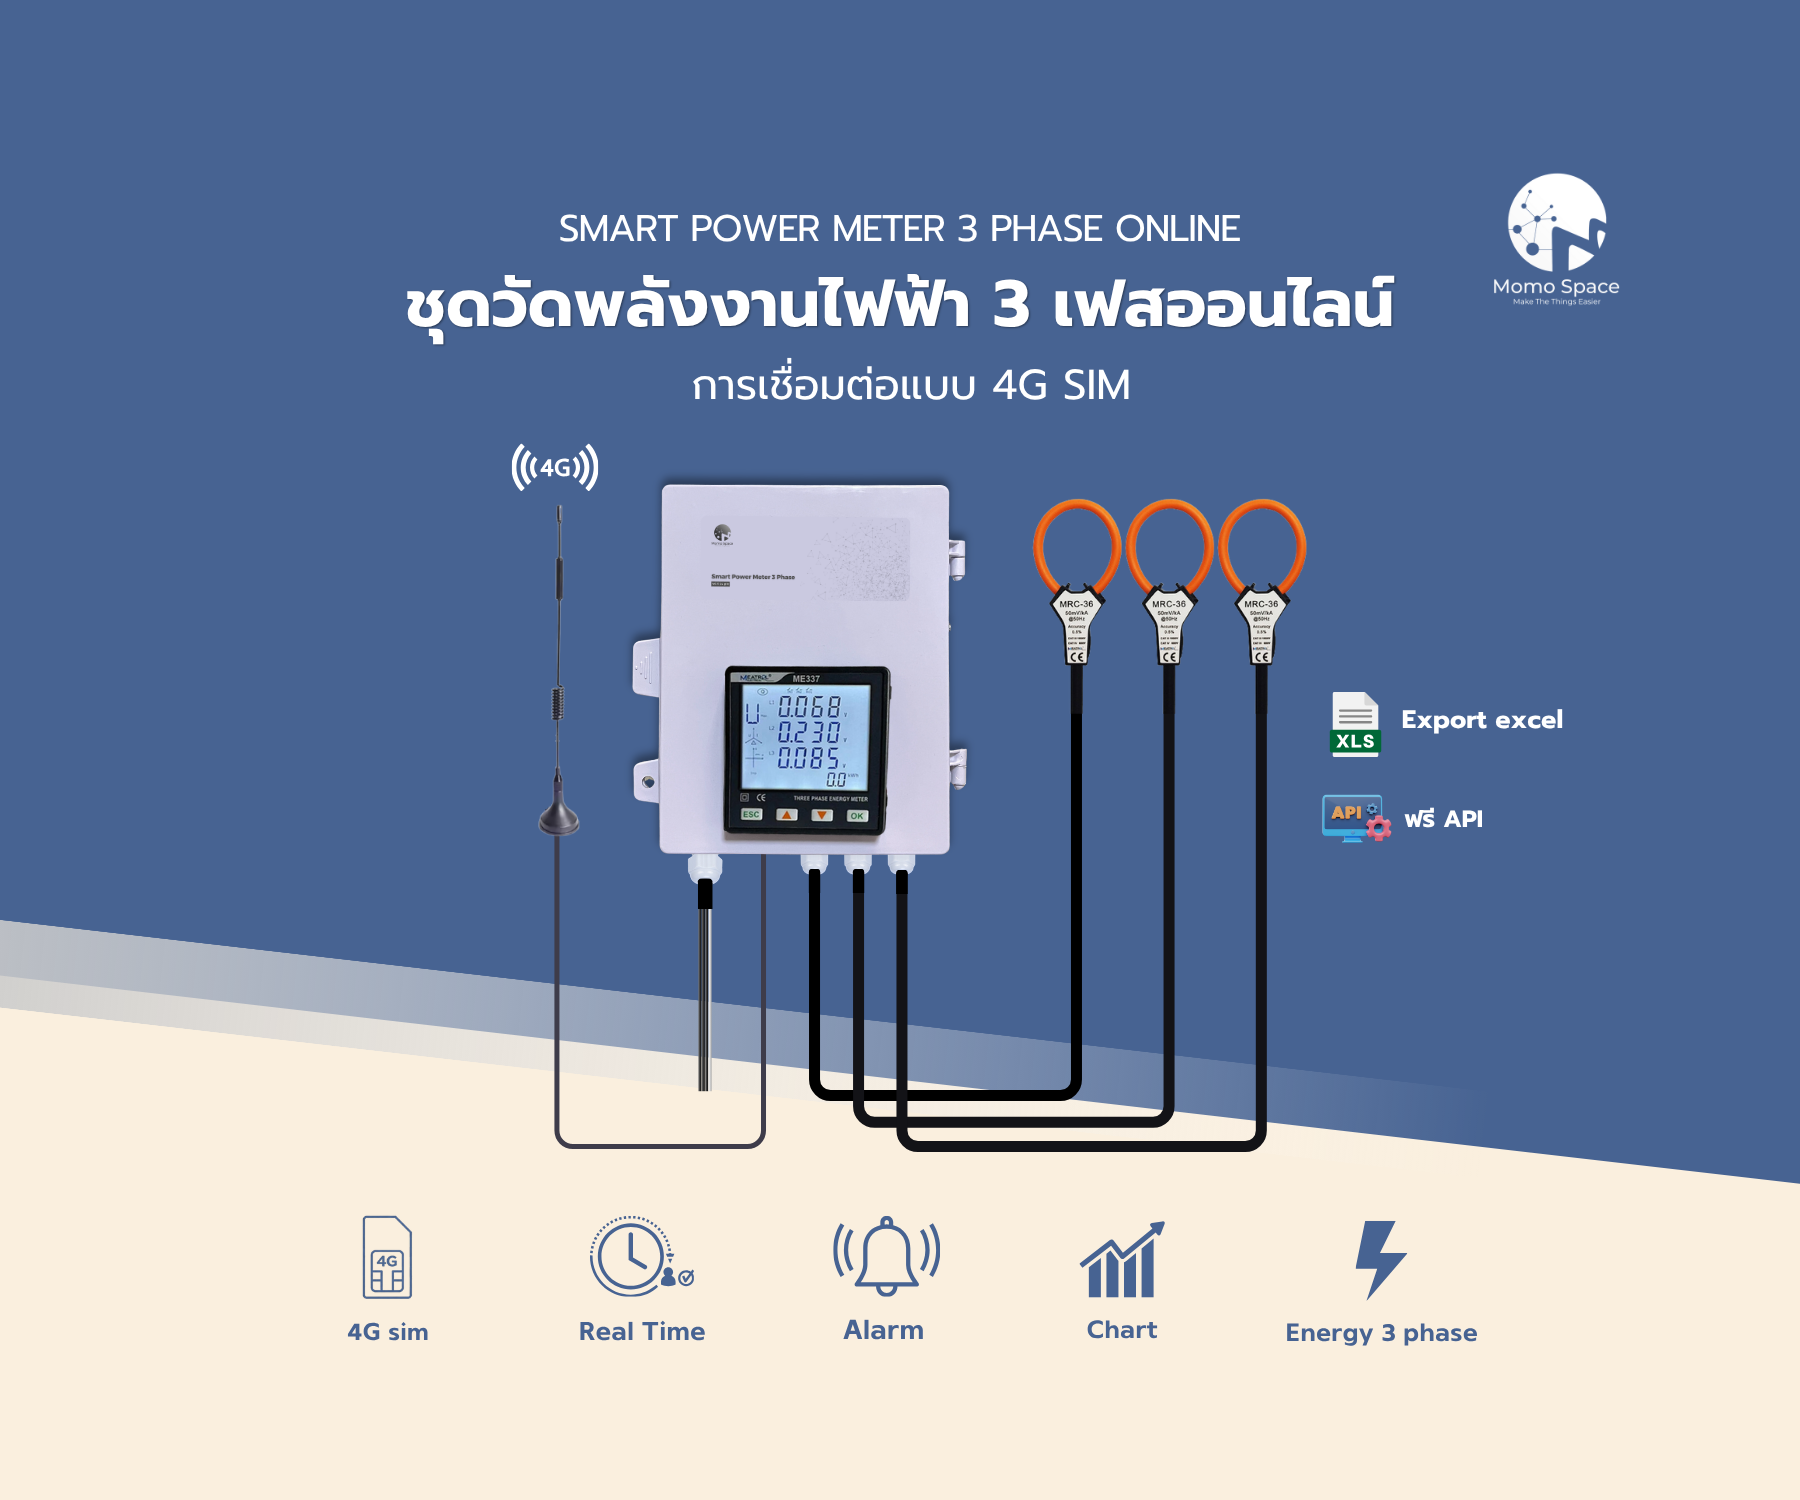
A three-phase meter at the main board records the real load for one to four weeks; the system works out the daytime average, the on-peak share, and a suitable array size with the share you would use yourself — from measurements, not estimates.
How it works
A three-phase meter at the incoming supply, recording the real load
Sends readings up over WiFi or a 4G SIM, which suits a temporary survey
The whole measured period kept, by day and by interval
The system works out the daytime average, the on-peak share, a suitable array size and the share you would use yourself
Charts and figures ready to put in front of a solar designer
A bi-directional meter then shows what is generated, used and exported
What it does
Every interval through the survey — the shape of consumption, not a monthly average.
Solar only produces by day, so the split is what the sizing rests on.
The system proposes an array size for the measured load, with the share expected to be self-consumed.
How much of the consumption falls in the expensive window, which changes the case.
Excel and PDF charts to hand to a designer or contractor.
The bi-directional meter shows whether the installed system performs as assessed.
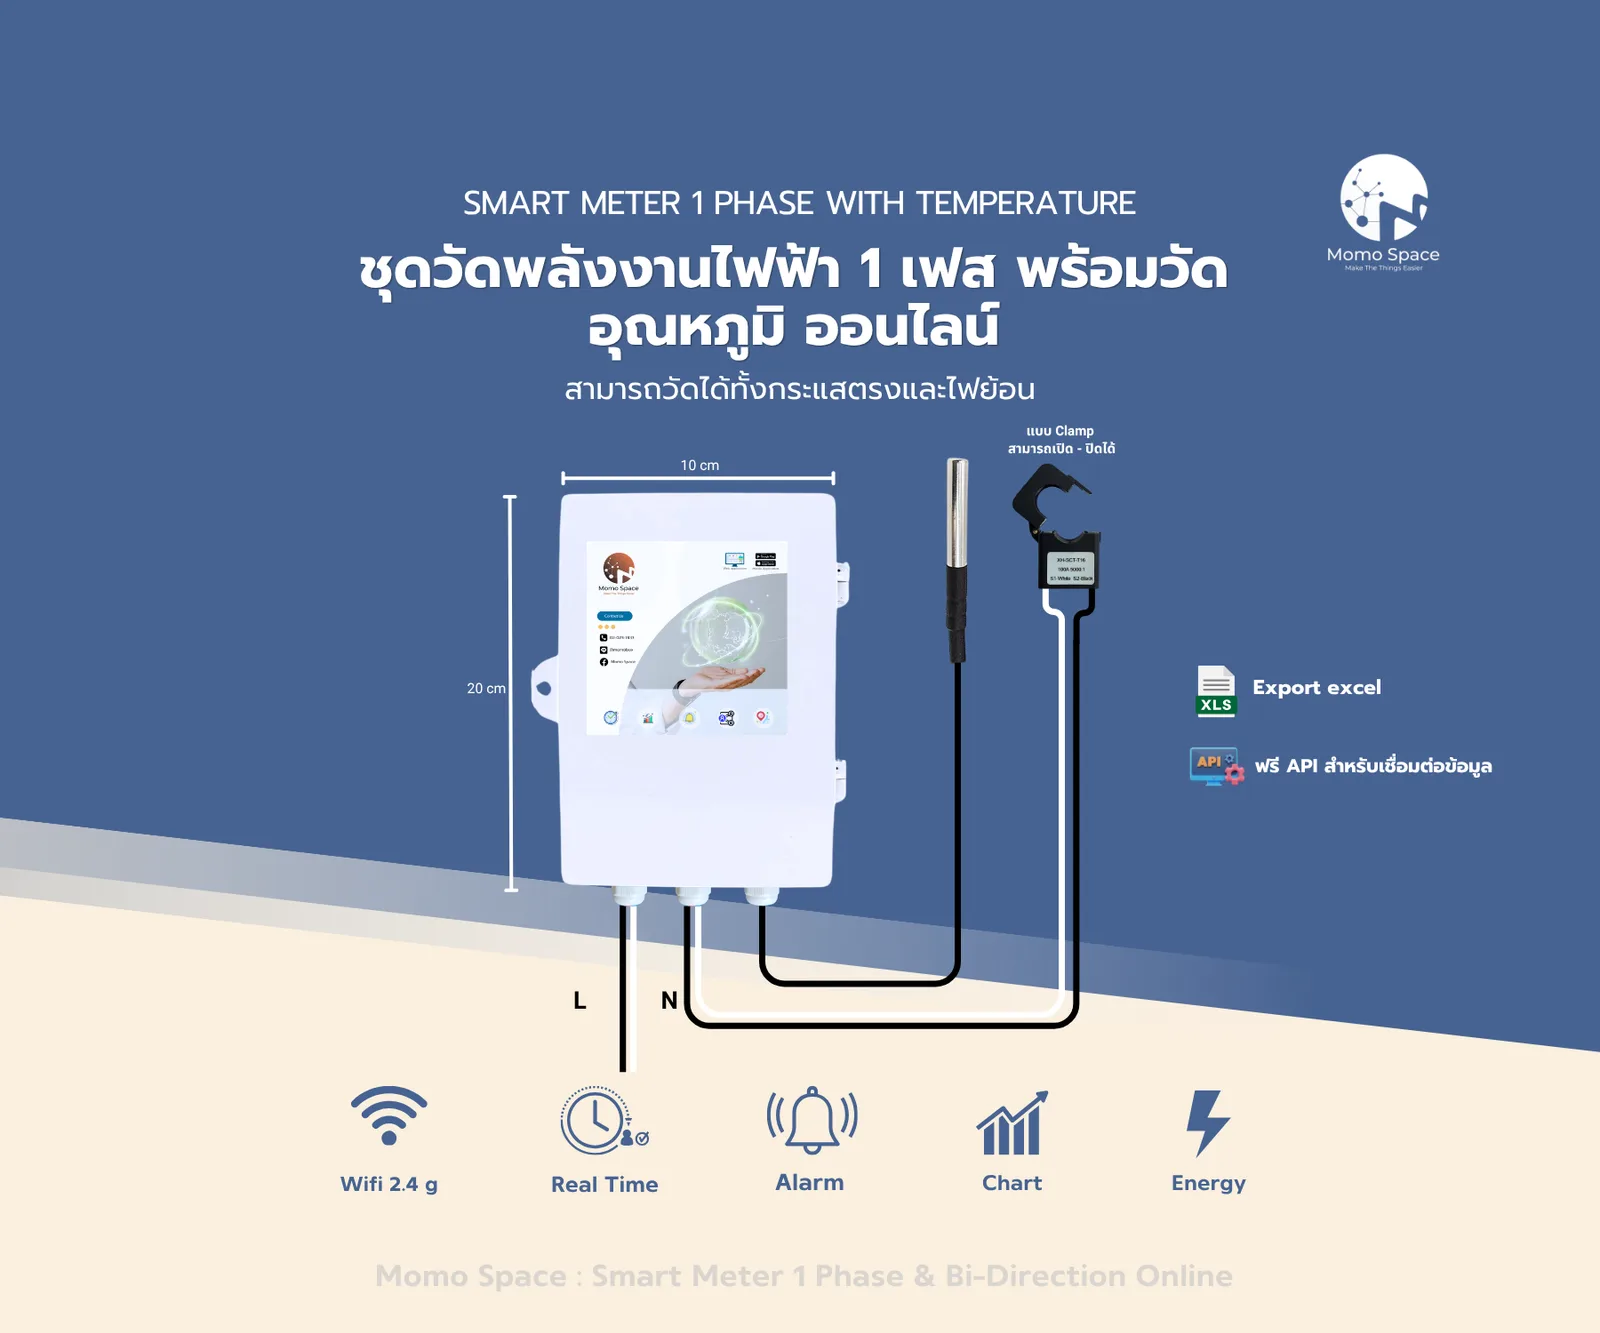
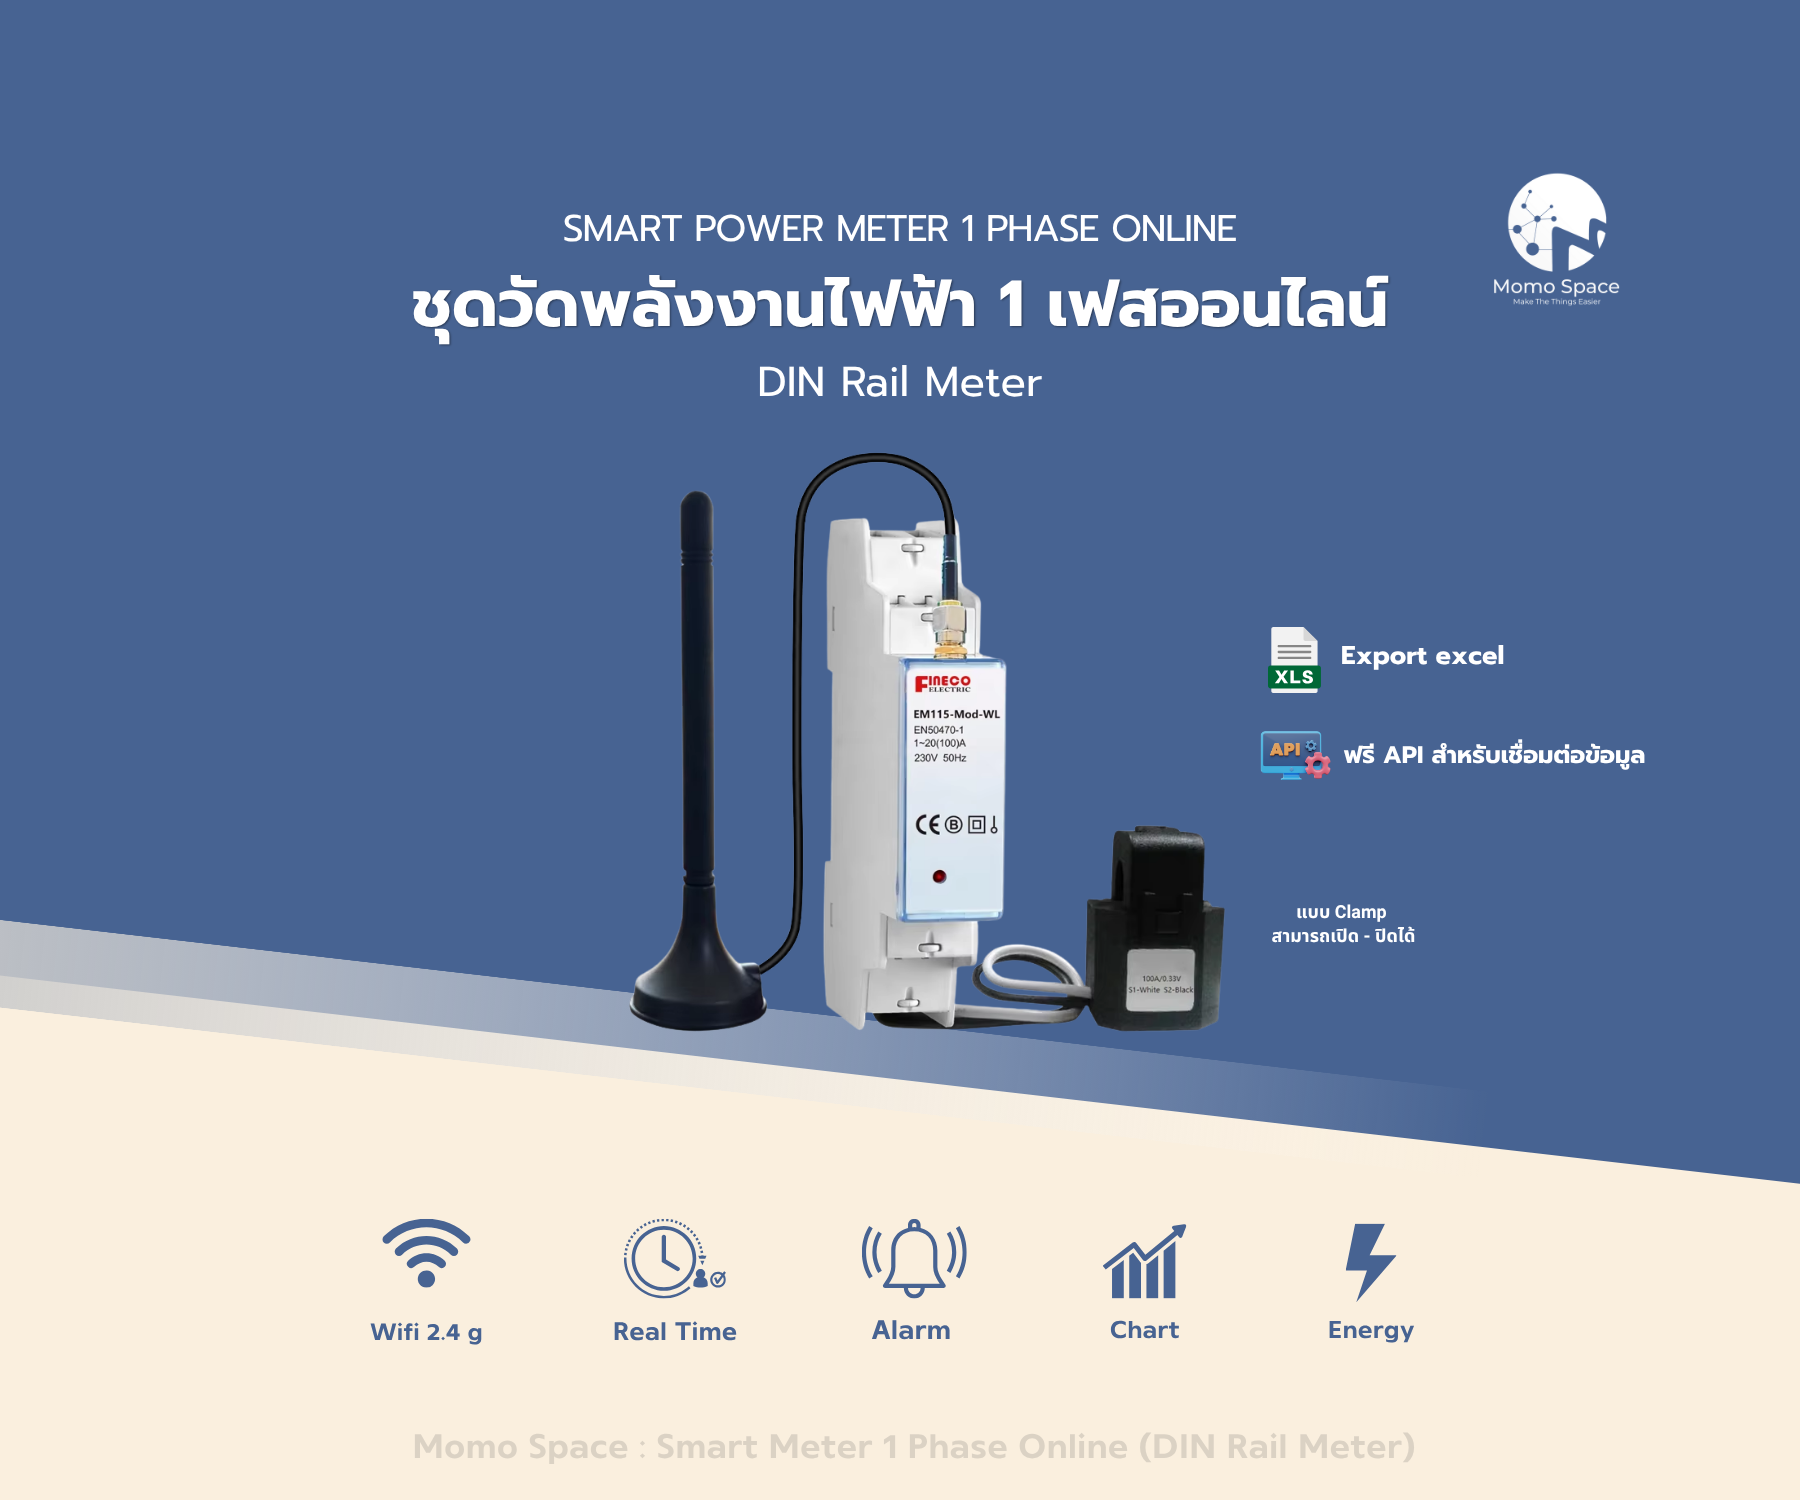
Devices used in this system
Prices are per set; how many you need depends on the site.

Where it fits
Heavy daytime use, well suited to solar
Steady load through working hours
Clear trading hours
Daytime load from the plant
Cold rooms and conveyors
Consumption right through the day
How we work with you
- 01Choose the measuring point
Usually the incoming board, or per building where more detail is wanted.
- 02Meter and record
One to four weeks covering both working days and a weekend.
- 03The assessment
The system calculates the suitable size and the self-consumed share, and exports the report.
- 04Verify after installation
Switch to a bi-directional meter and follow generation and use.
Related documents
Questions about this system
How long does the survey need?
Usually one to four weeks, covering ordinary working days and a weekend. If production is seasonal, measure a period that represents normal use.
Does the system size the array itself?
Yes — it calculates the daytime average, a suitable size and the expected self-consumed share from the measured data. The roof design itself, area, orientation and structure, still needs a solar designer on site.
Does the power have to be off to fit the meter?
Clamp-on CTs need no cutting; usually only the board being worked on is off briefly, and it can be booked outside working hours.
Is it still useful after the panels are up?
Yes. With a bi-directional meter it shows generation, self-consumption and export, which is how you check the installation performs as assessed.