Smart MDB
“The bill spikes on peak demand, and a power factor penalty lands on top”
Today's peak hit at 13:15 with two chillers starting together — stagger the second by 15 minutes to take about 40 kW off it
- The supply path: grid into the main board, then out to the feeders
- Feeder loads ordered so the heaviest stands out
- Power factor now, against the limit you set
- Today's peak demand and when it occurred
Figures on this screen are illustrative; a real one shows readings from your own site.
What you see
- No one can say when the peak happened, or which load caused it
- A kVAr penalty arrives, with no idea when the capacitor bank failed
- Phases out of balance or close to their rating, found out when a breaker trips
What we do
Energy, current, voltage, power factor and peak demand measured at the main board and the sub-boards, phase by phase and feeder by feeder, with a LINE alert as a reading approaches its limit.
How it works
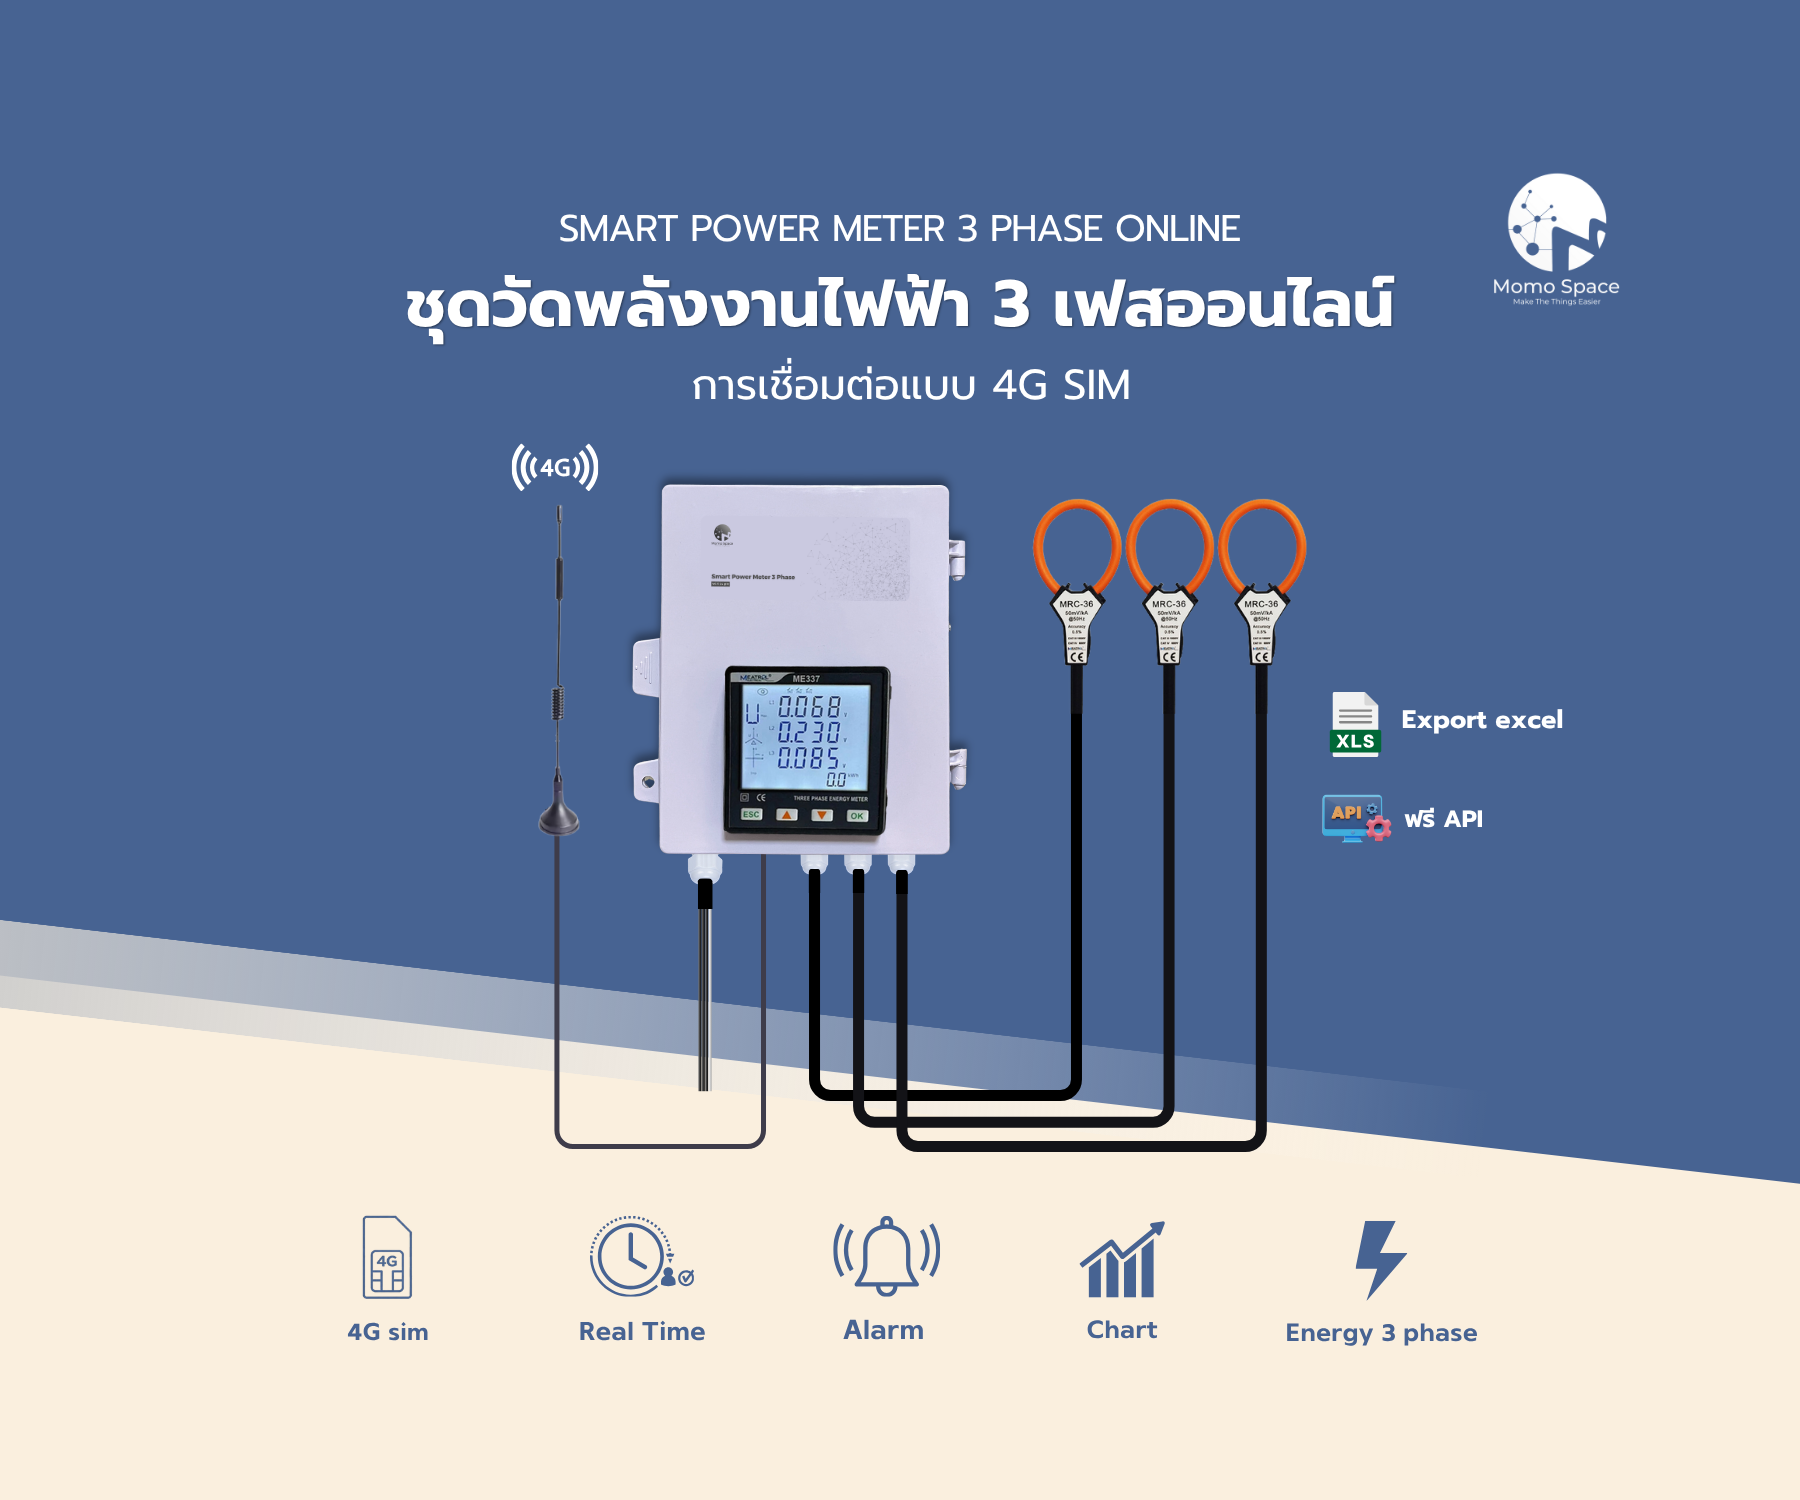
CTs clamped at the main and sub-boards, measuring energy, current, voltage and power factor
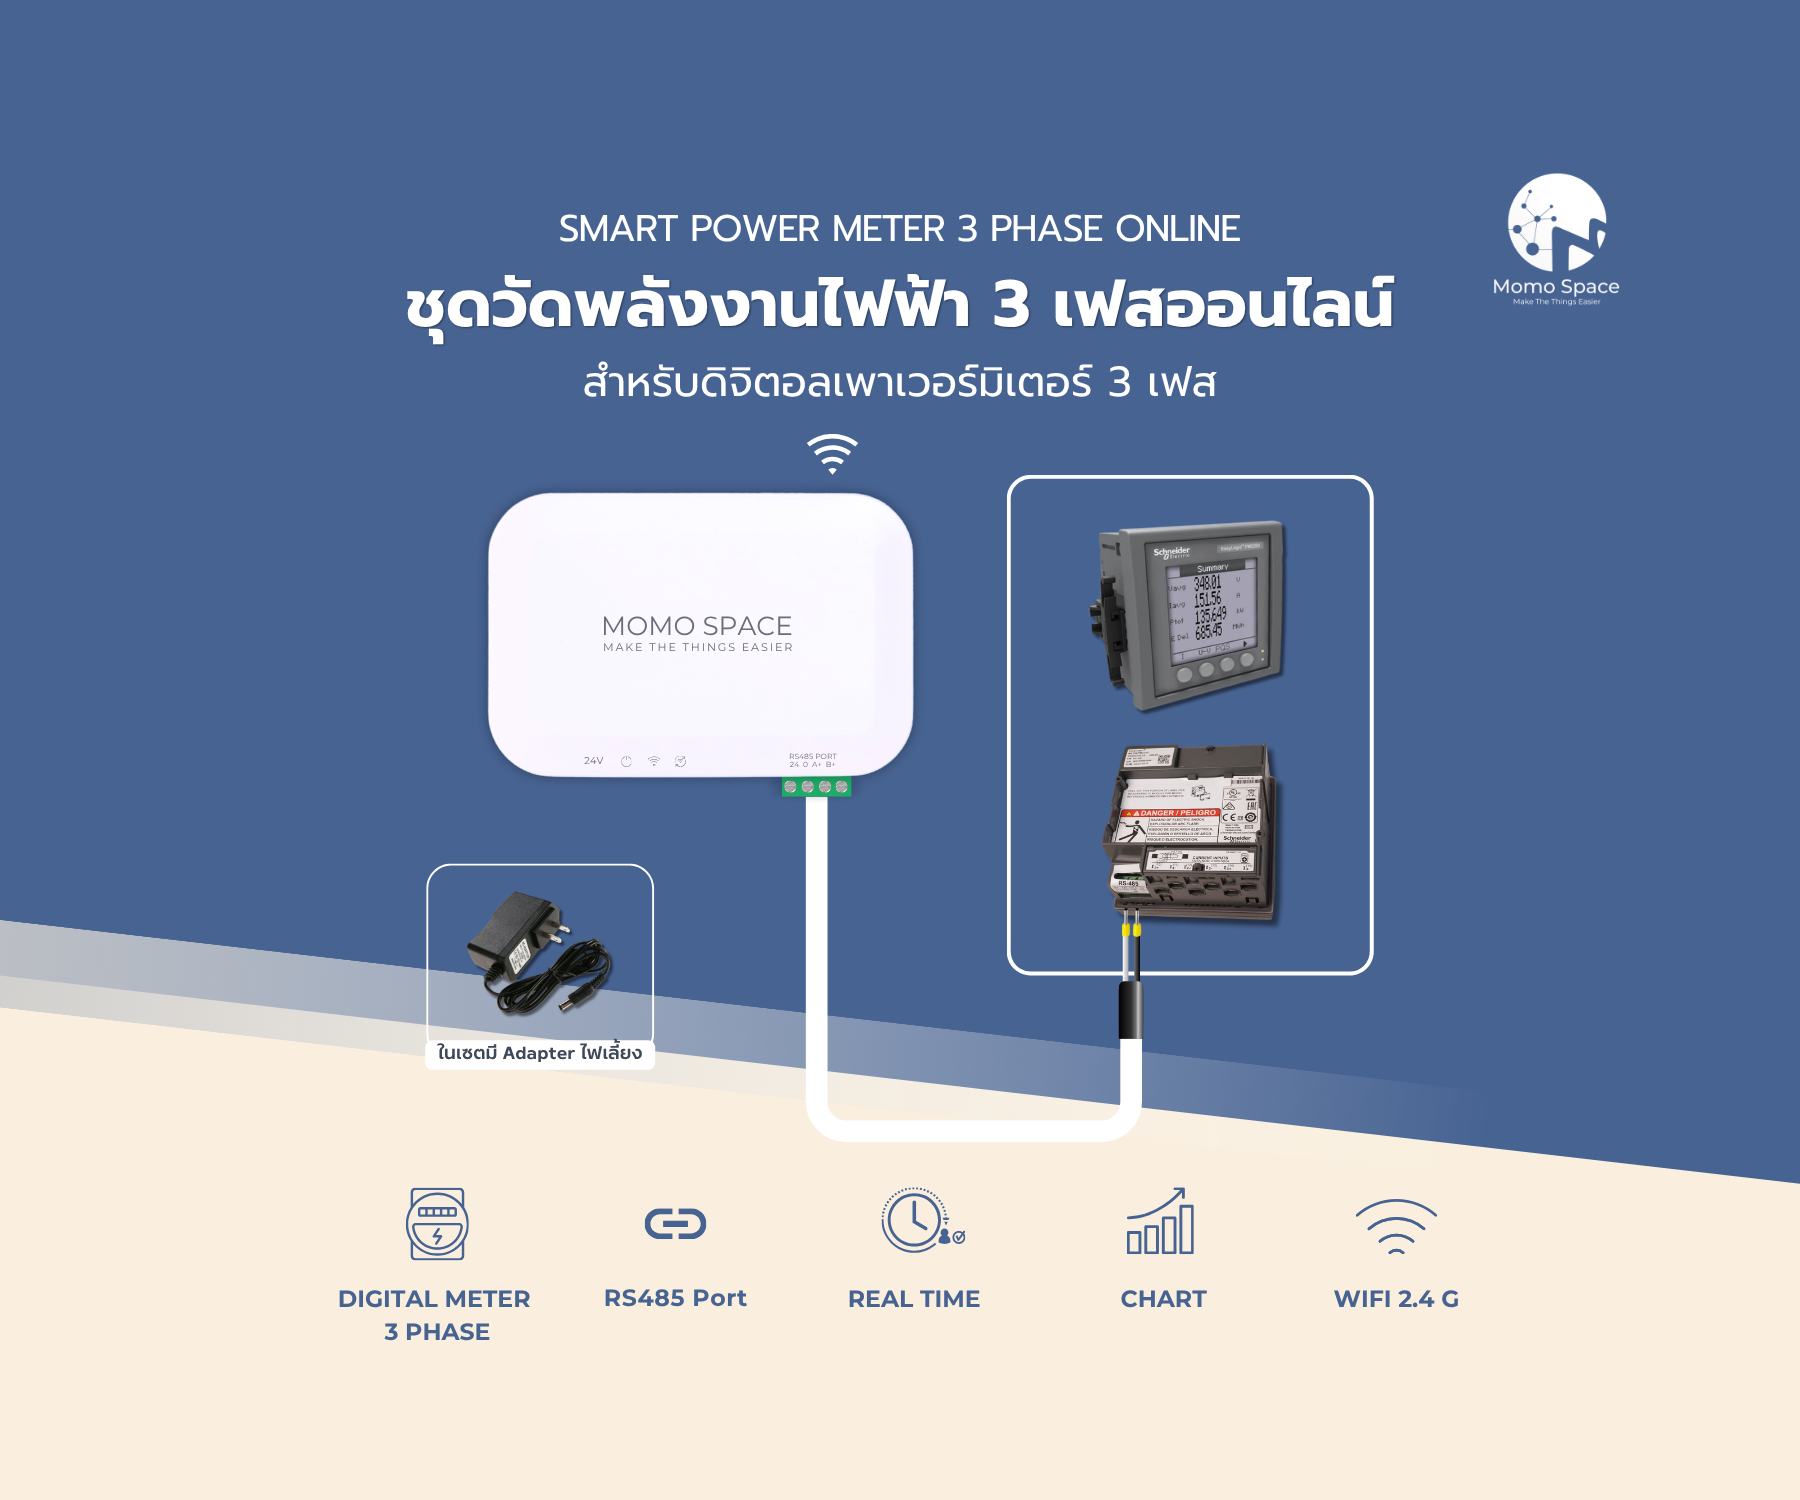
Reads meters of any brand over Modbus and sends them up over WiFi or a 4G SIM
Every interval kept on servers in Thailand, PDPA-compliant
Momosight works out which load drove each day's peak and warns when power factor starts trending down
The supply path from the grid to each feeder, live and in history
LINE when a rating is approached or PF slips, and a monthly energy report by email
What it does
The peak each day and the moment it happened, so starts can be staggered.
Tracked continuously, with warning before it reaches a kVAr penalty.
Imbalance between phases, and which feeder is close to its rating.
Existing Modbus meters are read in through Mspace V2 — nothing is ripped out.
Daily and monthly summaries emailed automatically, and Excel for the accounts.
Every board at every site from one place, with access per site.
Devices used in this system
Prices are per set; how many you need depends on the site.


Where it fits
Main and line sub-boards
The main board and the floor boards
Boards serving each tenancy
Boards feeding critical systems
Plant and kitchen boards
Boards for cold rooms and conveyors
How we work with you
- 01Survey the boards
How many, their breaker ratings, the cable sizes and any meters already fitted.
- 02Install and check
CTs clamped and signal wiring run, then readings checked against the utility meter.
- 03Limits and recipients
Load and power factor thresholds, and the electrical team's LINE group.
- 04Support afterwards
Annual MA with remote and on-site support.
Related documents
Questions about this system
Does the board have to be switched off?
Split-core and Rogowski CTs clamp around the cable without cutting it. Usually only the board being worked on is off briefly, and it can be booked outside working hours.
Can it use the building's existing meters?
Yes, if they speak Modbus RTU/TCP — Mspace V2 reads them in. Only meters with no communication port need replacing.
What current can it measure?
It depends on the CT chosen; split-core and Rogowski versions cover large cables. We pick them against the board's rating during the survey.
Will it really cut the demand charge?
It shows when the peak happens and which load caused it — the information needed to stagger equipment. How much comes off depends on what the site then changes.